A host is a computer or device providing networked services such as websites, applications, and computing resources to other devices. This includes web servers, virtual machines, mainframes, and desktop computers. In an IT environment, hosts are essential for running software, managing workloads, and providing platforms to deploy applications and services. In this article, you’ll get a detailed guide on host monitoring to help you identify and address all potential risks.
Why is Host Monitoring Important?
Hosts provide services such as applications, websites, access to computing resources, and file hosting to you and your users. In most cases, a single host might provide many services simultaneously. Even a minor change to a host’s state could significantly impact the performance of all its services, and by extension, the experience of the users.
Host monitoring lets you track the performance, stability, and overall health of your hosts in order to address and prevent threats. Tracking the host’s resource usage, responsiveness, and error rate can help with planning out services, creating failover plans, and quickly fixing issues before they have time to grow.
Host monitoring also helps with automating operations. For example, load balancers route incoming requests between two or more hosts depending on their current capacity. If one host fails, a monitoring service can trigger the load balancer to send all requests to the healthy host while simultaneously sending an alert to operations teams. This lets you handle infrastructure problems with little to no service interruption.
Host Monitoring Basics
There are two main types of hosts: physical and virtual.
Physical hosts are entire physical machines dedicated to providing services. An operating system (or OS) has complete control over the underlying hardware and can allocate it as needed to running applications and services. Desktop and laptop computers are examples of physical hosts.
Virtual hosts or virtual machines run within a hypervisor as software processes. Virtual machines are functionally identical to physical hosts, but operate within a virtual environment. While they have access to resources such as CPU and RAM, these resources are strictly controlled by the hypervisor. The benefit is that multiple virtual machines can run on a single physical host, saving money and resources. Google Compute Engine and Amazon EC2 instances are both examples of virtual machines.
For clarity, we are using a definition of host at the operating system or kernel layer. That means an Apache virtual host is an unrelated concept since those are in the application layer. Also, containers share many similarities to virtual machines, but we will address containers in a separate article.
Collecting Host Metrics
Hosts generate a substantial amount of data about resource usage, running processes, and user activity. These metrics are provided by the host OS. For example, on Linux hosts the kernel exposes system metrics in a special file called /proc/stat. You can see the contents of this file yourself using the cat command.
$ cat /proc/stat
cpu  12606874 8121 2297752 192059770 22315788 0 548532 1024184 0 0
cpu0 12606874 8121 2297752 192059770 22315788 0 548532 1024184 0 0
intr 1239771762 59 9 0 0 3052 0 0 0 2 0 0 0 3 0 0 0 0 0 0 0 0 0 0
ctxt 3702113966
btime 1536706040
processes 22146754
procs_running 2
procs_blocked 0
softirq 987029228 0 119823281 60304199 684575288 0 0 1310 0 0 122325150
The first line shows the CPU usage across all cores in “jiffies” which are typically hundreds of a second. You can read more about this file here. Other files like /proc/meminfo contain information about memory utilization.
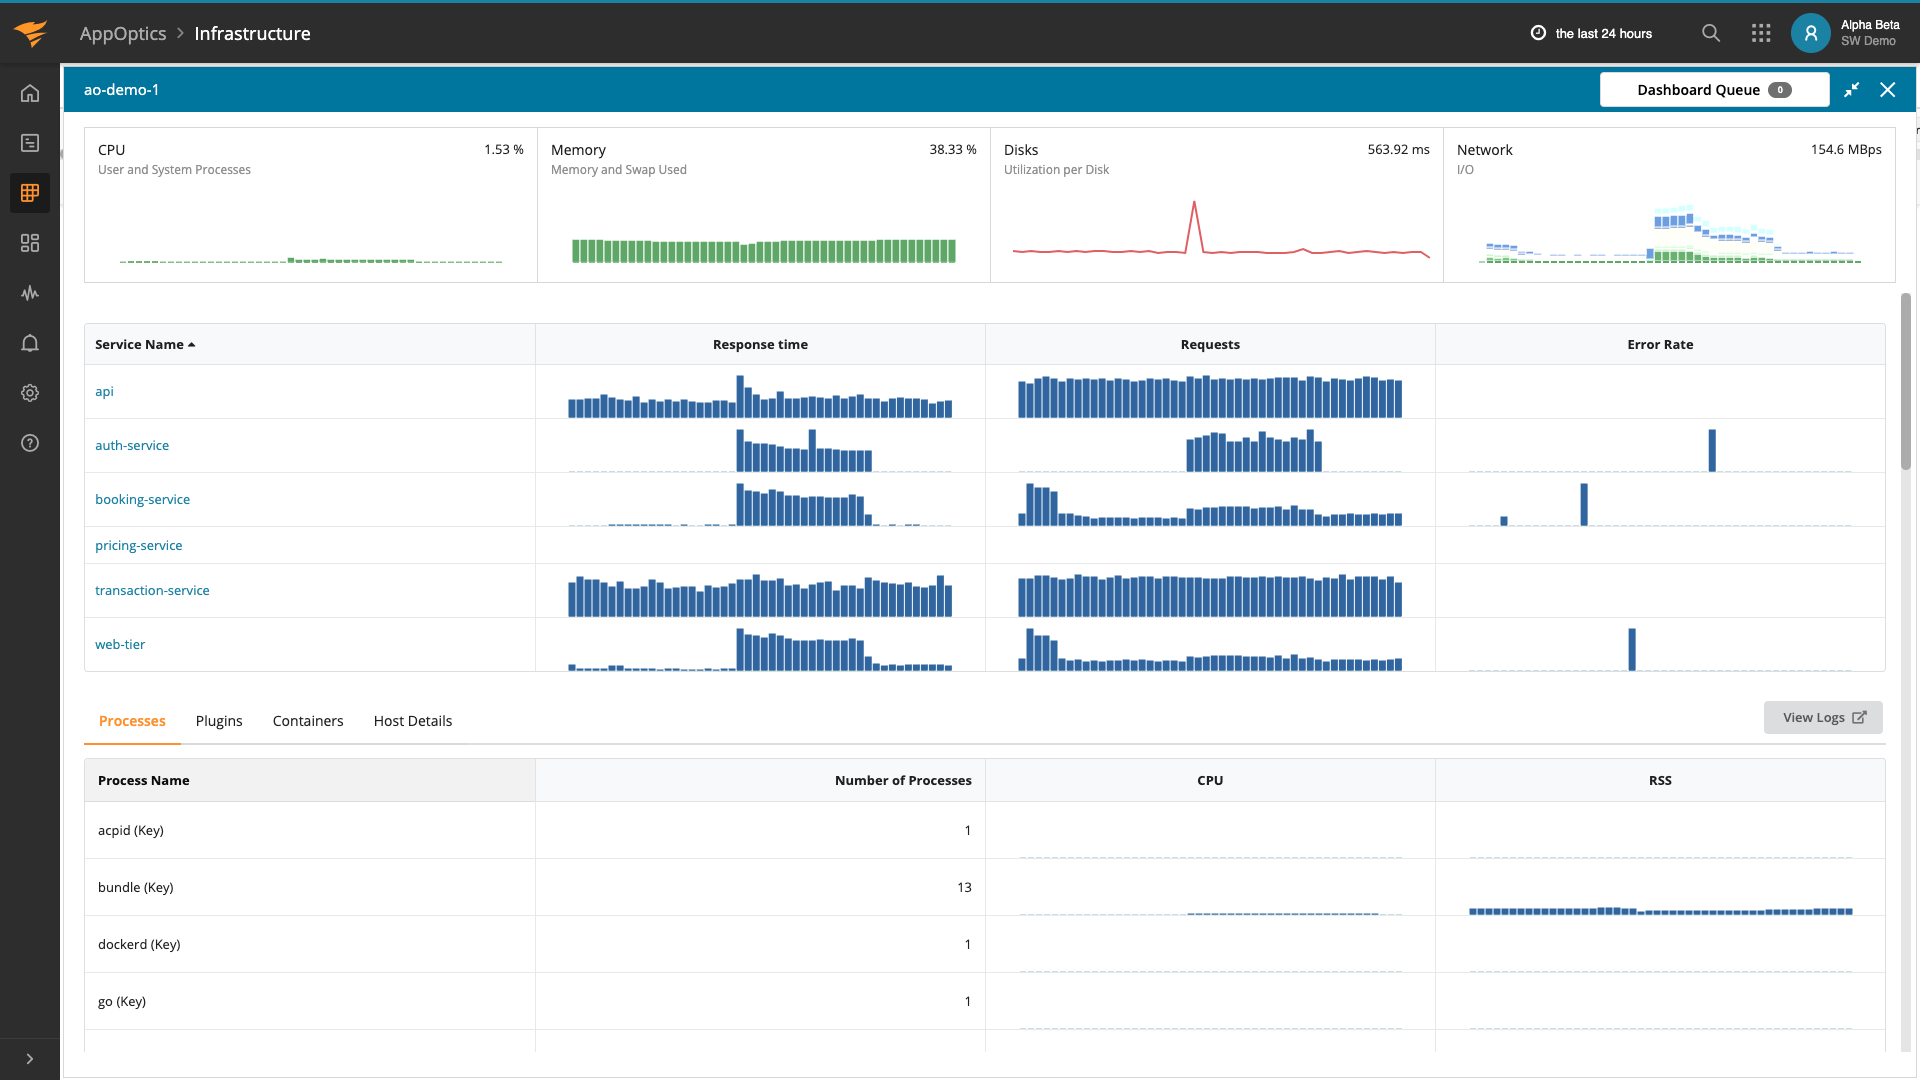
These stats are collected using frameworks such as the Intel Snap Telemetry Framework, Windows Management Instrumentation, statsd, and collectd. Software services installed onto hosts (called agents) collect metrics at repeating intervals. You can then use infrastructure monitoring tools such as SolarWinds® AppOptics™ to aggregate, monitor, and visualize host behavior over time.
Analyzing Host Metrics
There are five primary metrics to track for hosts: CPU usage, memory (RAM) usage, disk usage, network usage, and processes.
CPU Usage
CPU usage is the percentage of time that a host’s central processing unit (CPU) spends actively running tasks. The more tasks performed by the CPU over a period of CPU time, the higher its usage. For example, if CPU usage measures 20%, this means the host spent 20% of its time running tasks and 80% in an idle state.
If a host reaches 100% CPU usage, it can no longer dedicate time to running new tasks. This can result in slower performance for existing tasks, and an inability to start new tasks. As the host completes its running tasks, CPU usage will drop and performance will return to normal.
Memory (RAM) Usage
RAM (random access memory) is fast, short-term storage used to store OS and application data. Data written to RAM remains until it is released by the application or OS, or when the host shuts down. If RAM is exhausted, applications might experience crashes, unexpected results, or may be forced to close by the host.
To mitigate RAM exhaustion, OSes provide virtual memory, which is a secondary RAM pool. Virtual memory uses part of the host’s disk space as RAM, allowing applications to use it for storing short-term data. However, virtual memory is significantly slower than physical memory and can cause significant performance drops.
When memory gets critically low, the kernel may run a process called the “OOM killer”, which terminates processes to clear space. If your application suddenly stops running during high memory utilization, this may be the reason why.
Disk Usage
Disk storage is used to store long-term, persistent data. Disks persist data across reboots, allow users to access their contents, and can store significantly more data than RAM. Almost all software used by the host is stored on disks, and applications frequently use disk space to store and share data.
If a host’s disk space is exhausted, applications and processes that require disk access may generate errors, resulting in data loss. OSes typically reserve small amounts of extra space for their own use, but may refuse to start new processes or download updates until extra space is available.
Network Usage
Network traffic is the amount of data being transferred to and from a host at a given point in time. A host can transfer several bytes to several terabytes of data per day. This depends on the services it provides, the number of active users, and the capacity (or bandwidth) of the connection between the host and the user.
Depending on the applications that are serving network traffic, high traffic can lead to high CPU and RAM usage on the host. This can result in noticeable delays and slow load times for users. In extreme scenarios, users may be disconnected entirely and forced to re-send their requests.
Processes
Processes are running instances of applications and services. For each process, the host tracks statistics such as its name, resource consumption, and runtime. Each running process takes up a percentage of CPU time, which modern CPUs manage by rapidly switching between running processes. However, processes that require significant processing power could cause slowdowns for the entire host.
OSes also have a maximum number of processes that they can track at any given time. For example, a virtual 32-bit Debian Linux host can only manage 32,768 processes simultaneously. Once this limit is reached, any attempts to start a new process results in an error.
Troubleshooting with Host Metrics
When troubleshooting one of your hosts, metrics play a key role in determining the source and severity of the problem. For example, imagine you maintain a build server for building and deploying applications from source code. Using a tool like Jenkins, you scheduled a build to run every two hours. Recently, you’ve noticed that the build process is taking longer and performance is suffering. To understand the cause, we need to look at the metrics collected from the system.
Checking for Resource Exhaustion
A leading cause of poor performance is resource overutilization. High CPU or RAM utilization indicates that the system is incapable of managing its current workload. For a build server, high disk usage can result in build failures, since Jenkins requires free space in order to cache downloads and build artifacts.
Collecting metrics via an agent shows exactly how CPU usage has changed over time. The following chart shows frequently recurring spikes in CPU usage, resulting in average overall CPU utilization of 86.4%.
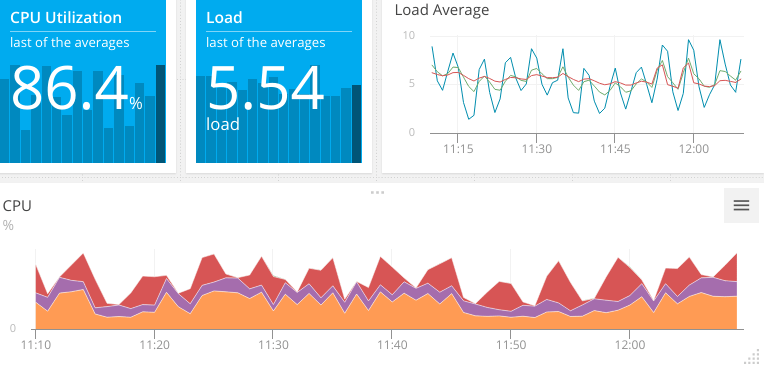
The load value shows us that there are more processes waiting to execute than the system can handle. Load is the number of processes that are either executing or are waiting to execute. On a dual-core system, a load of 2.0 means each CPU core is running a single process at 100%. An average load of 5.54 indicates that on average, our system is running two processes at a time and has over three more queued. To find out what causes this increase, we need to see what processes are currently running.
Identifying the Cause
System-level metrics can tell us the overall state of a host, but to find the source of the problem, we need to look more granular. If our monitoring solution collects process-level data, we can query it. Alternatively, when we connect directly to the host, we can use native utilities for viewing individual processes by name, CPU or RAM usage, active running time, and more.
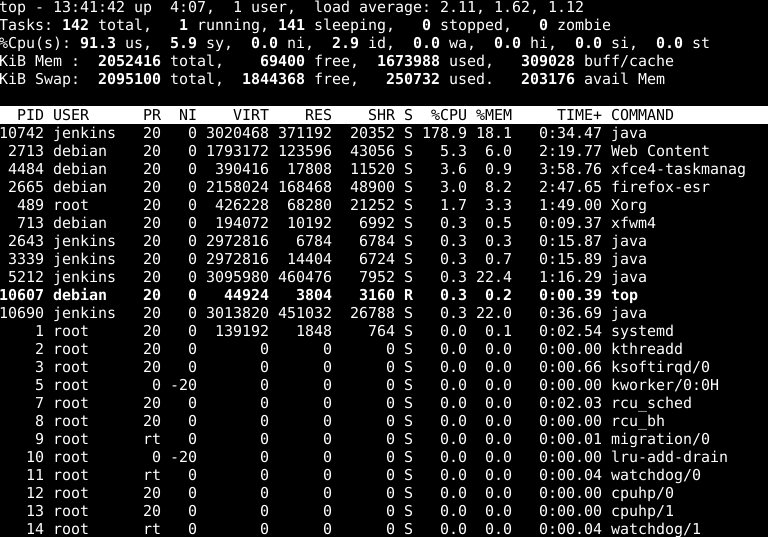
In the above image, we can see that the java process is using significantly more CPU and RAM than other processes. It also shows us that this process was started by Jenkins (indicated by the USER column) and is using nearly all available CPU capacity (indicated by the %CPU column).
Gathering Information
We’ve identified the source of the problem, now let’s determine the root cause. There are several ways to troubleshoot application behavior, including application performance monitoring (APM) and using logs. Services such as SolarWinds® AppOptics™ and SolarWinds Loggly® even allow you to integrate host metrics, APM metrics, and logs to get a comprehensive view of your entire infrastructure. In this example, we’ll use Jenkins’ built-in web UI to troubleshoot its behavior.
Almost immediately, we can see a problem with the build process. A new build is currently running, even though the previous build is only two minutes old. As it turns out, Jenkins was configured to run a build every two minutes instead of every two hours. This caused Jenkins to continuously run resource-intensive builds back-to-back, resulting in our high CPU utilization.

Resolving the Problem
For this problem, the solution is as simple as changing the build schedule in Jenkins. If we needed to run more frequent builds, we could:
- Upgrade or replace the host with more powerful hardware
- Run fewer processes, resulting in less competition for resources
- Distribute the build process across a cluster of hosts
Monitoring for Future Occurrences
To proactively respond to resource capacity issues before customers complain, we can configure an alert to notify us when it detects high CPU usage for an extended period of time. Since our CPU utilization averaged 86% over 30 minutes, we can easily create an alert in AppOptics that checks if CPU usage exceeds a certain amount over that same period of time:
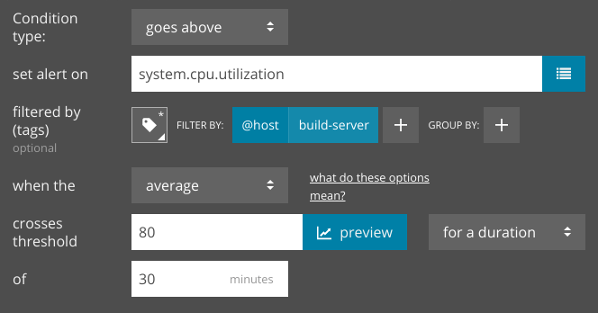
We can do the same for any other metric collected by AppOptics by changing the “set alert on” field to our metric of choice including RAM usage, network input/output, process count, and more.
Conclusion
Ensuring the health of your hosts is key to keeping your applications and services running smoothly. With AppOptics, you can start collecting host metrics from across your infrastructure in a matter of minutes. Learn more about host monitoring with SolarWinds AppOptics, then sign up for a free trial account to start monitoring your hosts today.
