Containers have taken the world by storm. By allowing developers to pack software into lightweight, self-contained environments, containers make deploying applications easier and faster. Containers have innumerable use cases, from running local applications to powering the world’s largest websites.
Containers allow developers to package applications and their dependencies into self-contained, reproducible units. These units can be independently started, modified, replaced, and shut down without impacting other units. This makes them extremely useful for a number of applications including data processing, web hosting, and one-time tasks.
Containers are similar to virtual machines (VMs) because they provide an environment for applications to run in. This environment has its own IP address space, process space, and even its own file system. You can enforce per-container policies such as resource limits, networking rules, and error-handling behaviors. The key difference is that containers share the host operating system’s kernel, relying on a feature called control groups (cgroups) to provide isolation between the container and the host. This allows them to be faster and more lightweight than VMs, but at the cost of isolation.
Why is Container Monitoring Important?
Container monitoring is vital to ensuring the operation of your applications and hosts. Containers are frequently created, destroyed, and moved to different hosts. This can have a significant impact on performance and availability if done incorrectly. In addition, rogue containers can create security and stability issues for host machines, threatening the host itself and the applications running on it.
Lastly, containers are a key component in automated deployments. Developers use continuous integration and continuous deployment (CI/CD) tools to package and deploy their applications as containers with little to no human input. This has made application deployments significantly easier and faster than before. However, because these processes are automated, developers and operators need monitoring tools to alert them to errors and anomalies.
Container Monitoring Basics
Container monitoring involves three major components: container runtimes, container orchestrators, and containers themselves.
Container Runtimes
Container runtimes are software services used to run and manage containers. The most popular runtime is Docker, which is used by over 79% of large companies. Docker containers start as images, which are read-only snapshots of a file system. Containers are created using images as templates along with additional parameters such as CPU and RAM limits, networking rules, and access to files and folders stored on the host. You can access information about each container using the docker stats command as well as the host OS.
Container Orchestrators
While runtimes manage containers on a single host, orchestrators allow you to manage containers on multiple hosts. Kubernetes, the most popular orchestrator in use today, works by managing container runtimes running on each host. Instead of deploying containers directly, you define a Deployment which describes the desired state of your application. Kubernetes then handles the process of creating and deploying containers as units called Pods in order to match the state described in the Deployment. Kubernetes also handles networking, resource sharing, redundancy, failure tolerance, and metrics collection via the Metrics API.
Docker Swarm is another popular orchestrator tool. Like Kubernetes, Docker Swarm handles container deployments across multiple hosts while providing high availability, scalability, and redundancy. Docker Swarm is provided by the creators of Docker, and as a result offers high level of integration and support with Docker.
Containers and Pods
Container and Pod metrics include CPU usage, RAM usage, disk input/output, and network traffic. These are typically reported by the container runtime, but can be accessed using commands such as docker stats for Docker and kubectl top for Kubernetes.
Container metrics can be collected directly from Docker using the Docker API or command line. However, Docker also creates a UNIX socket on the host system that other applications can interact with. Not only does this allow software on the host machine to interact with the Docker service, but containers themselves can access this socket given the right permissions and configuration. This is commonly used in combination with monitoring tools such as SolarWinds® AppOptics™ to deploy a monitoring solution as a container.
Service Meshes
An extension to the container orchestration paradigm is the service mesh—a system that allows a variety of containers to be linked together. Modern service meshes typically run on top of a container orchestration system. One of the most popular service meshes is Istio; it easily deploys on top of Kubernetes, and provides additional monitoring, logging, routing, and security features. To add these features, Istio injects a “sidecar”—a container attached to the service or application container to provide isolation or encapsulation.
Istio also offers adapters to send telemetry data to a variety of back ends. For example, it contains an integrated handler for SolarWinds, allowing for shipping of logs and metrics to SolarWinds Papertrail™ and AppOptics respectively. This requires a few configuration steps. The first is to define the various metrics and logs that need to be collected. This can be done by utilizing the metric and logentry templates. The SolarWinds adapter can then be set up as a handler, and finally, rules created to bind the metrics and logentry templates to the handler itself. Once all three items are configured, metrics will show up in AppOptics, and log information in Papertrail.
Another popular service mesh is Linkerd, though it has had a circuitous lifecycle. Originally, Linkerd was utilized to simply connect containers together. A second project, Conduit, was created as the service mesh that utilized Linkerd. Eventually, the two were combined, and Linkerd 2.0 is the consolidation of both. Unlike Istio, Linkerd does not use sidecars, but injects a proxy, and intercepts traffic to and from the container.
Analyzing Container Metrics
There are several metrics provided by containers, runtimes, and orchestrators, so we will split them into two categories: containers and Pods, and platforms.
Container and Pod Metrics
Container metrics describe the state of individual containers. Pods share many of the same metrics as containers, while adding additional Kubernetes-specific information.
Identifiers
Docker and Kubernetes assign unique names and identifiers to images, containers, Pods, and other objects. These can be used to filter metrics to specific container instances, or group container metrics by image.
Status
Docker containers can have any one of the following states: created, restarting, running, paused, exited, and dead. Most of the time, containers will be in the running state and are deleted once they’re finished running. An exited or dead container could indicate a problem with the container’s configuration, a poor deployment, or a problem with the runtime or orchestrator.
Resource Consumption
Containers share CPU time, RAM, and disk space with the host and with one another. This means a container running a resource-intensive application could monopolize the host and prevent other applications from running. Container runtimes can prevent this by setting per-container and per-resource quotas, such as limiting the container to a single CPU core or a percentage of the host’s RAM. If the container exceeds its quota, the runtime may slow its performance oreven terminate it.
Deployments (Orchestrators Only)
Deployments define how containers and Pods are deployed to a cluster. Kubernetes and Docker Swarm track cluster-wide statistics including the state of each deployment, the number of containers or Pods in each deployment, and the number of replicas created for redundancy and scaling. For high-performance, high-availability production environments, deployment metrics are essential for ensuring users can always reach your application.
Platforms
Container runtimes, orchestrators, and hosts also report important metrics about container health.
Container Count
Each runtime tracks the number of containers it currently hosts. Although this count may change frequently, it can be used to detect unexpected changes in a deployment. For example, a container count of zero could indicate a deployment failure or host failure. A container orchestrator might also use this information to determine how populated a host is, and if necessary, migrate containers to a less crowded host.
Resource Consumption
Container runtimes constantly monitor container resource usage. If a resource becomes exhausted, the runtime may prevent new containers from starting and even terminate existing containers. Orchestrators can also report on resource consumption across the entire cluster. This allows you to plan for capacity increases, set quotas, and modify deployments as necessary.
Service Meshes
As mentioned, service meshes typically sit on top of a container orchestrator, and add more information to what is otherwise provided by Kubernetes, Mesos, and more. Istio offers a Mixer component, which is able to send logs, metrics, and traces to a variety of back-end infrastructures. Let’s take a closer look at how to analyze these using monitoring tools.
Network Services
Since the core functionality of a service mesh is to link containers across a network, gathering metrics and information regarding the data flowing between containers is important. This functionality can be extended to generate a service graph—a map of the different containers and the traffic flow through the various hops. Istio generates the service graph automatically, but Linkerd requires manual configuration to perform the same functionality.
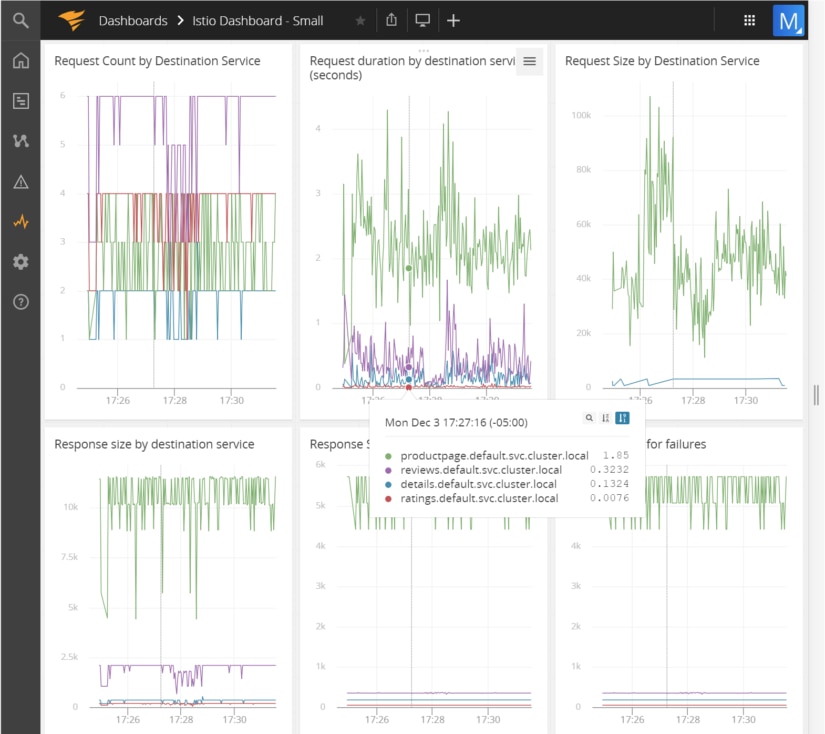
AppOptics allows you to create a dashboard to visually monitor various HTTP calls that are being made to the sample application. In the below screenshot, we are monitoring a variety of different things:
- The number of requests to hit a specific service
- How long each request took
- How big the request to each service was, along with the response size from each service
- How big the response was for requests that succeeded and failed
These are just some sample metrics that can be collected; Istio allows for the definition of custom metrics via templating.
Service Mesh Logs
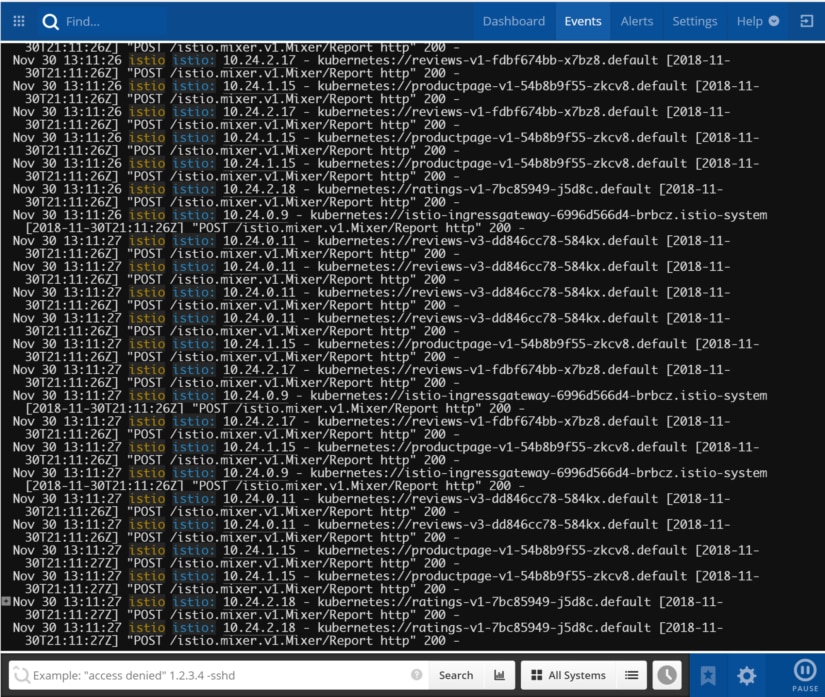
Logs offer you fine-grained data for monitoring and troubleshooting production systems. The SolarWinds adapter for Istio is able to send logs to Papertrail, where you can view a live feed as they arrive.
For example, in the below screenshot, we can see information from an Istio sample application being logged. Requests are flowing through the Istio ingress gateway to the back-end services. Specifically, you can see the requests coming in for the product page URL (exposed to the outside world), which in turn requests the product page and reviews microservices to populate the response.
Troubleshooting with Container Metrics
Troubleshooting a container deployment requires a combination of container metrics, runtime metrics, and orchestrator metrics. For example, let’s look at a common scenario when running a new Docker container. We have a website written in Java that we want to deploy as a container. We can create the container without any problems, but after a short time, the container suddenly stops and enters the Exited state. At the end of the container’s log file, there’s a message that says “Killed”, which is an indication that the container was forced to stop.
To find out what’s causing the problem, we need to monitor the container’s performance from the moment it’s created to the moment it’s killed. We can do this using metrics collected from the container, from the host, and from Docker.
Checking for Resource Exhaustion
By default, containers use as much CPU, RAM, disk space, and network bandwidth as the host has available. Like any process, the container will fail to start if RAM or disk space is exhausted.
Let’s look at an example by charting out the overall resource usage for our Docker host. Here we see the system’s total RAM usage (shown in red), Docker’s memory usage (shown in blue), and Docker’s CPU usage (shown in green).
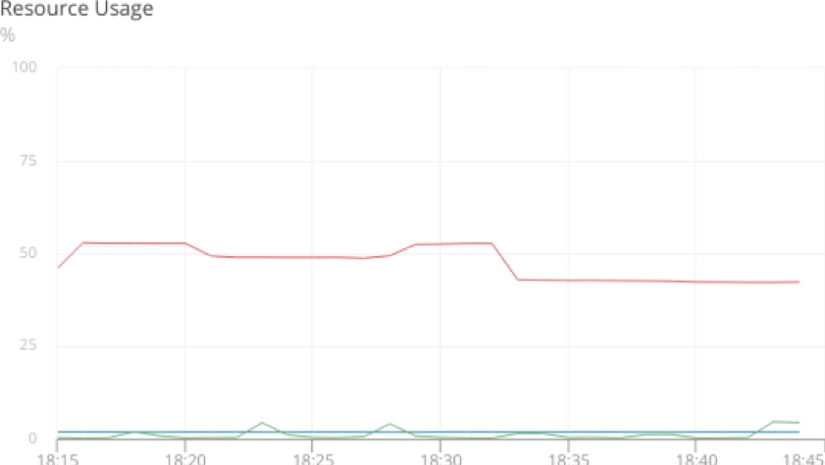
It’s clear that CPU usage isn’t a factor, and Docker itself isn’t using a significant amount of RAM, so the problem must be with the container itself.
Identifying the Cause
If the host’s metrics aren’t indicating a problem, then perhaps the container’s metrics will. Drilling down to the container level lets us view resource availability and consumption as the container sees it, not as the host sees it. By charting this data, we can see the container quickly expands to use 100% of its available memory, even though the previous graph showed that only 60% of the host’s memory was in use:
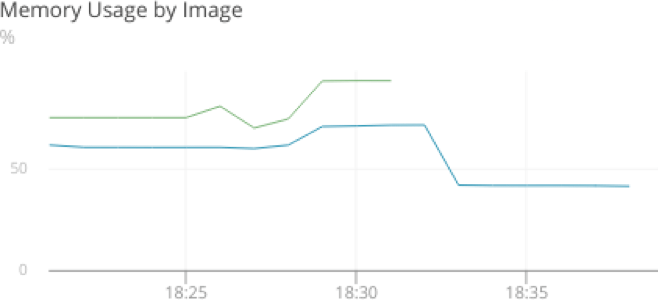
Now we know the container is exhausting all of its available memory, even though the host has plenty of RAM available. We’ll need to look at our Docker configuration to understand why this is a problem.
Gathering Information
Docker allows you to set resource constraints on individual containers, preventing them from overusing host resources and slowing down other processes. If the host runs out of available memory, it will throw an out-of-memory (OOM) error and terminate processes to free RAM. Docker tries to mitigate this by killing containers before they can place the entire system at risk, but you can set a resource constraint to prevent this from happening in the first place.
We can check whether the container is constrained by using the docker inspect command to view the parameters that the container was started with:
$ docker inspect container_name

...
"HostConfig": {
  "Memory": 524288000,
  "MemorySwap": -1,
  "MemorySwappiness": 0
...
Now we can see the problem. The container started with a memory limit of 500MB (524,288,000 bytes) and no access to swap storage. As the application started handling requests, accessing the database, and performing other actions, memory usage increased until the container reached its limit and was forced to stop. This is indicated by the OOMKilled line included in the output from docker inspect:
...
"State": {
  "Status": "exited",
  "Running": false,
  "Paused": false,
  "Restarting": false,
  "OOMKilled": true,
  "ExitCode": 137
...
Resolving the Problem
An important quirk of containers is that they view the entire host’s memory pool as available memory even if they’re started with a set limit. This tricks our container into believing it has access to 16GB of RAM instead of the 500MB we assigned to it.
One solution is to simply increase this limit when starting the container. We can also tell the Java Virtual Machine (JVM) running inside the container the maximum amount of memory it can use. This allows the JVM itself control how much memory (specifically, heap space) the Java application can use. To do this, we need to modify the Dockerfile used to generate the base image, build a new image, then use that image to create our new container.
# Original Dockerfile command
CMD     java -jar /spring-petclinic/target/*.jar

# New Dockerfile command limiting memory usage to 512 MiB
CMD     java -Xmx512M -jar /spring-petclinic/target/*.jar
Newer versions of the JVM (8u131 and up) include experimental support for automatically detecting memory limits when running inside of a container. This way, we can specify a memory limit when creating the container, and the JVM will automatically recognize it when starting the application:
# New Dockerfile command using experimental memory limit detection
CMD     java -XX:+UnlockExperimentalVMOptions -XX:+UseCGroupMemoryLimitForHeap -jar /spring-petclinic/target/*.jar
Monitoring for Future Occurrences
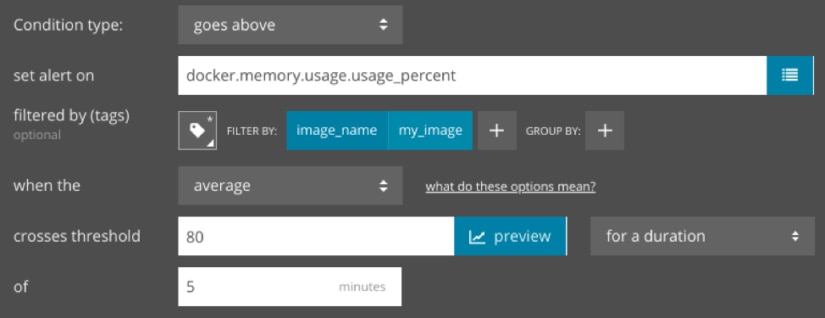
There are several ways for us to monitor for potential container failures. First, we can create an alert that notifies the DevOps team if container memory usage exceeds a certain percentage. By tagging our metrics with container and image IDs, we can narrow the scope of the alert to a specific container or all containers based off of an image:
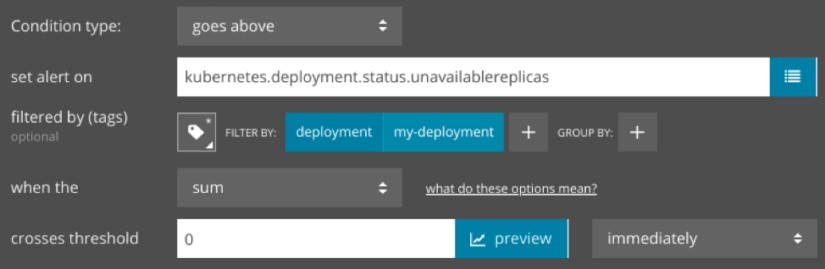
Second, we can create an alert that notifies us as soon as a container fails. This could indicate a severe error that requires immediate attention. If we deploy this container using Kubernetes, we can create an alert that triggers if any Pods become unavailable:
Conclusion
Containers play an essential role in IT environments of all sizes. From one-man development shops to the world’s largest service providers, the popularity and use of containers will continue to grow over the next several years.
If you’re ready to start monitoring your containers, click here to learn how AppOptics helps track the health and performance of your Docker and Kubernetes deployments. In just a few minutes, you can have an automated monitoring solution deployed across your entire Kubernetes cluster. Sign up for a free trial account to get started.