What Are Runtime Metrics?
Runtime metrics can help us understand how an application is performing.
SolarWinds® AppOptics™, a SaaS-based, full-stack infrastructure and application monitoring tool, now reports four categories of runtime metrics: CPU, memory, garbage collection times, and event loop times. Each metric category provides a view into how resources are used by an application. Each category has multiple metrics characterizing how the resource is impacted by the application.
What Can I Learn by Looking at Runtime Metrics?
By looking at runtime metrics over time, you can develop a sense of what “normal” is for your program. Metrics indirectly reflect how the application is performing.
A simple example is a metric reporting how much memory our program is using. If a time-based graph of the metric is climbing up and to the right, then we can good guess our program has a memory leak.
But applications often allocate memory when they’re starting up. So “normal” might be up and to the right for the first 5 minutes, and then memory usage might level out. It’s important to spend some time learning what your normal is, so it’s easier to identify an anomaly.
A High-Level Overview of the Event Loop
What Is the Event Loop?
The event loop is how node schedules everything making up a node program: JavaScript code, IO, timers, promises, and callbacks. Each labeled icon in the diagram below represents an internal node process that selects JavaScript code to run. Each yellow box represents where JavaScript code can run. The event loop continues until there’s nothing left to run, at which point the event loop exits and the program stops.*
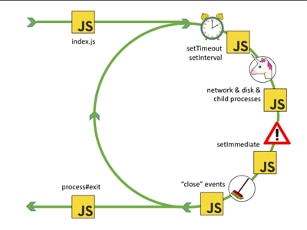
*Chart from Bert Belder’s presentation at Node.js Interactive Europe, September 2016
Why Does It Matter?
The event loop is where node identifies JavaScript code ready to be executed. Code that’s ready to be executed has to wait for the event loop to select it before it can be executed. If the event loop is taking a long time to complete a cycle, then code is waiting a long time to be executed.
The event loop will take longer as the workload increases. But node is designed so if one part of the code does compute-intensive work or synchronous IO, then that code stops everything else, including the event loop, from executing until it has completed.
A slight note about how node works (async vs. sync impact on event loop).
While all JavaScript code in a node application runs in a single thread, node itself is not single threaded. When an asynchronous IO call is made in node, e.g., fs.readFile(), the IO is executed in a background thread; when it completes the JavaScript, callback is invoked. While the background thread is executing the event, loop continues to run and chooses other ready-to-execute code.
But when a synchronous IO call is made, the event loop stops and cannot execute other code. The same is true if JavaScript code is executing compute-intensive work. The event loop does not stop code executing; it waits until the code stops. This can be because the code has completed, or it has requested an asynchronous activity and is waiting for the callback (or a promise to resolve).
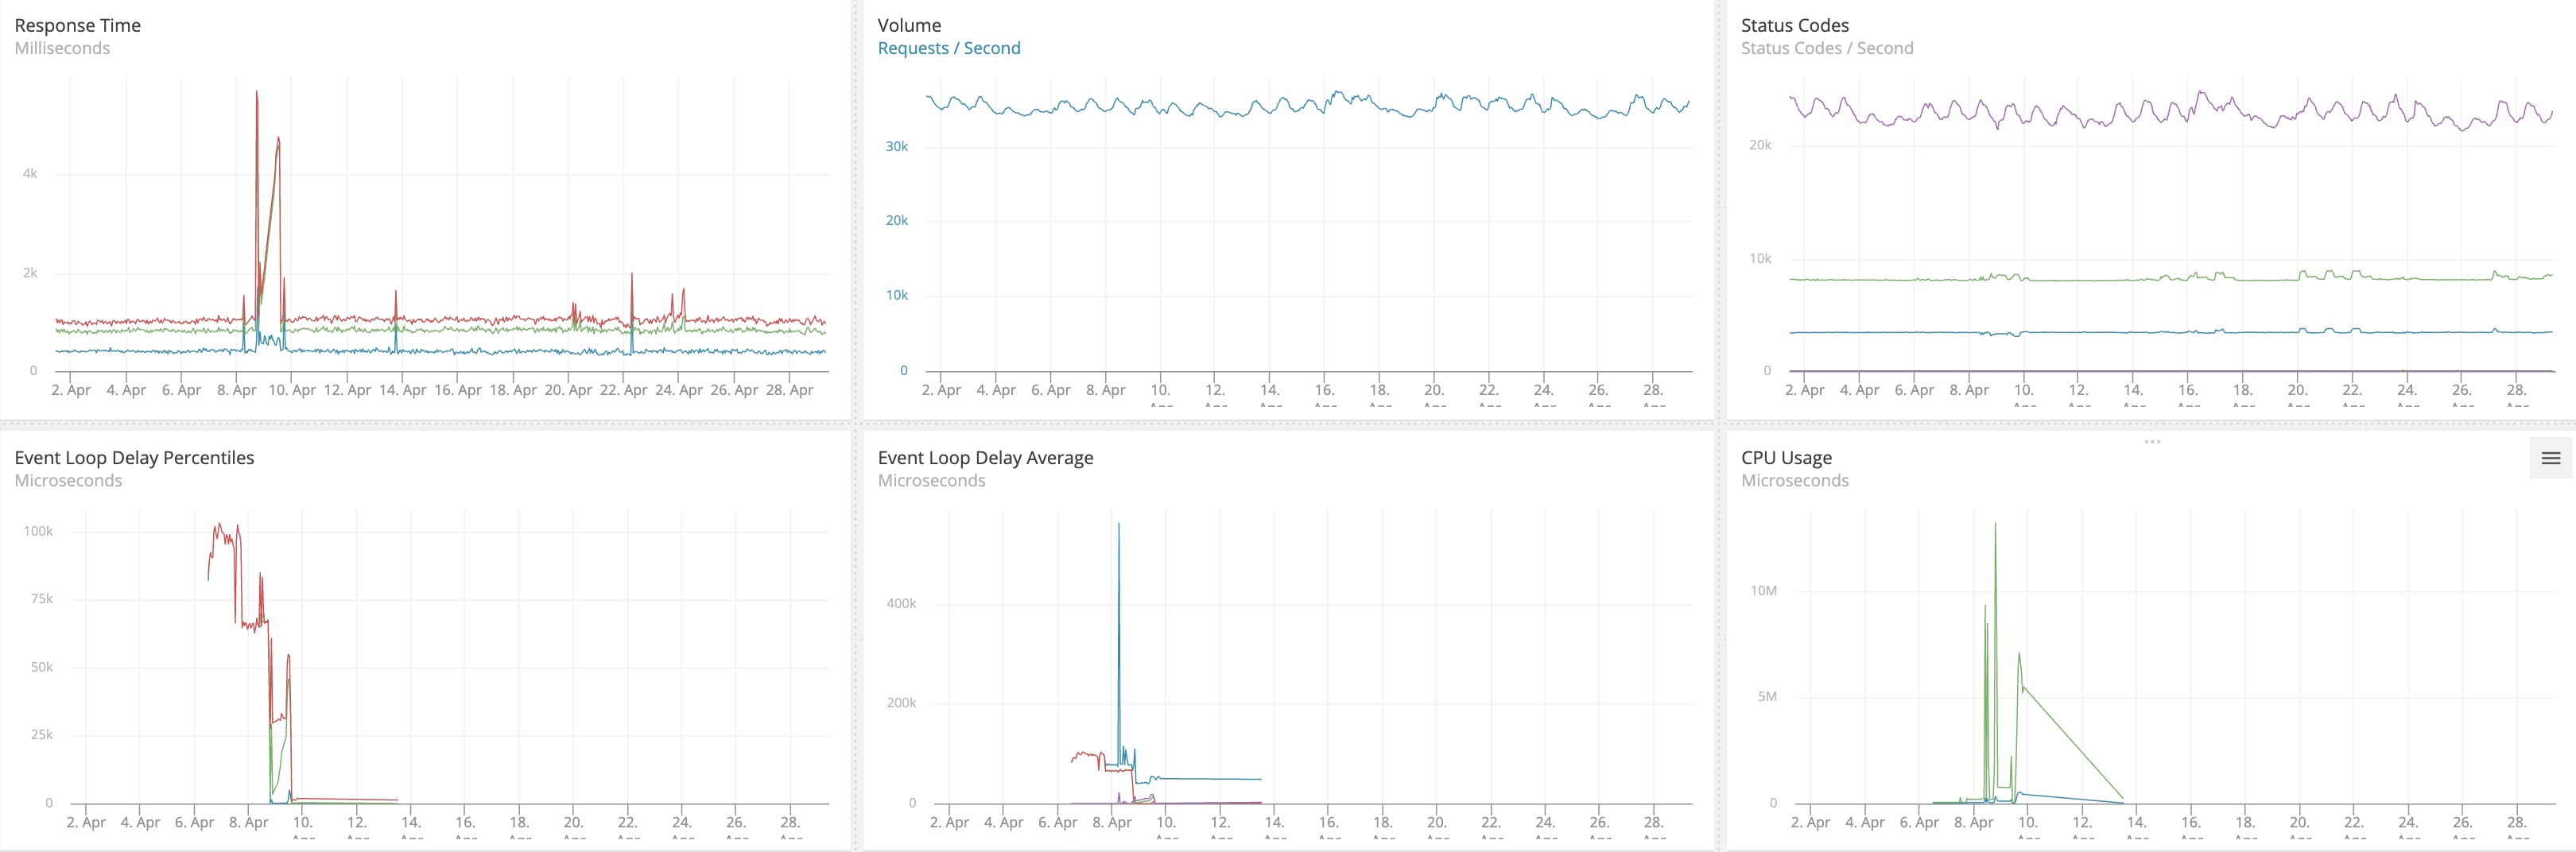
What Metrics AppOptics APM Reports on the Event Loop
AppOptics reports the event loop lag. We measure how much longer the event loop takes to complete than the time node reserves for IO processing. The lag is reported in multiple ways, but the most useful is often the percentiles because they show normal and worst-case lag times in more detail than simple averages.
Using Metrics to Determine the Impact of Synchronous and Compute-Bound Tasks
The following graphs reflect the performance of a small test application designed to show the performance impact of synchronous and asynchronous code. The application has two endpoints, /sync and /async, each of which fills a 10,000,000-byte buffer with random bytes 100 times before responding to the request with a little timing information. A 250ms interval timer represents code other than the /sync and /async endpoints—this code could be handling other endpoints or executing background tasks. Additionally, a 10-second interval timer collects stats about the performance and uses the AppOptics API to send application-specific measurements displayed in the graphs.
The following sequence of graphs each cover a 60-minute window and illustrate the contrast between filling the buffers synchronously and asynchronously. The left half of each graph shows the metrics resulting from requests to the /sync endpoint; the right half shows requests to the /async endpoint. Both endpoints are being called an average of once every two seconds; the driver, multiload, randomizes the times and will make overlapping requests; it’s not a single request every two seconds.

Clearly, the event loop was often waiting for the synchronous buffer filling to complete because the 95th percentile (red line) lag time is about the same time as the request to /sync takes to complete. The 90th percentile (green line) is close while the 50th percentile (blue line), which appears to be the same as the x-axis, is roughly 350 microseconds. In the right half, the asynchronous buffer fills don’t block the event loop and its loop times are less than 0.1 ms (the 50/90/95 percentiles are approximately 2/20/90 microseconds).
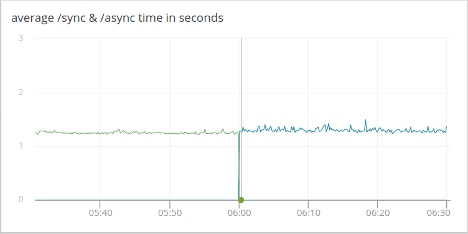
There’s a slight increase in the absolute time it takes to process the asynchronous calls due to the overhead of executing the buffer fills in a background thread and other code being executed in the application can delay the “buffer is full” callback. The approximate times in seconds are 1.25 for synchronous requests and 1.30 for asynchronous requests.

Request counts, reported for 10 second windows, don’t change—they average 5 requests. That’s expected with the multiload driver making an average of one request every 2 seconds. The variation is because multiload randomizes the request timing; it doesn’t send on fixed 2-second intervals.
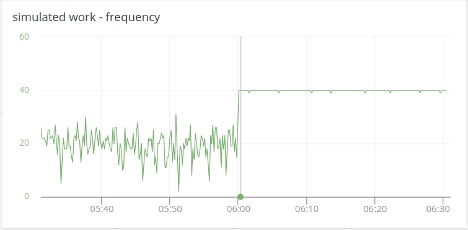
Simulated work is a timer that pops every 250 ms; it represents application code other than responding to the /sync and /async endpoints. (It could be responding to other endpoints, background tasks, outbound requests, etc.) Simulated work executes about 20 times in each 10-second window with /sync requests but doubles to 40 times with /async requests. And the 40 times each 10-second window is predictable and repeatable. When making synchronous requests, the frequency ranges from three to 30 executions, which results in less predictable execution times.
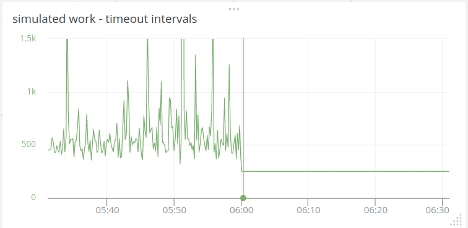
Remember, simulated work is just a timer that pops every 250 ms. But when synchronous code is executing the timer’s callback cannot be executed, the delays range up to 1.5 seconds when the expected time is 250 ms. When making asynchronous requests, the timeout interval is a flat line within a millisecond of 250. Synchronous activity clearly has a major impact on how much clock time executing other code takes.
Summarizing Performance and the Event Loop
Low event loop lag is one sign of a well-engineered application. (It could be the sign of a completely idle application too, but let’s hope that’s not the case.) As the workload of an application grows, some increase in event loop lag is expected. While “normal” lag for the event loop is specific to an application and the load running, a fair rule of thumb is event loop lags over 100 ms deserve investigation. Event loop lags over 500 ms are usually a serious problem but could be “normal” if there’s a very high, but well balanced, load on the application.
No single metric can provide perfect insight or the answer to all performance problems. The best approach is to watch the event loop runtime metric and learn what your application’s “normal” is at given loads. That will help you spot what’s not right when something happens.
It’s also important to have application-specific metrics, like the “simulated work” and “/sync and /async” metrics in the example. It’s about how your application is performing, not just runtime metrics. Runtime metrics offer perspective that can help reveal what a performance issue is—in this example, the long event loop lag times point to synchronous or compute bound code. But the erratic performance and depressed counts of “simulated work” are what matter to your application. Poor application performance is what initiates the hunt for root causes.
Have requests for other runtime metrics? Let us know. support@appoptics.com
If you haven’t experienced the simple-to-install, easy-to-use AppOptics APM, maybe now is the time. Explore its comprehensive infrastructure server, virtual host, and container monitoring. Combine these with the auto-instrumented root cause, detailed service and transaction traces, and insights down to the line of poor performing code. Sign up for a 30-day free trial.