In general, databases are an integral part of any information system. They are used for storing, querying, and updating critical business data. Naturally, the availability, performance, and security of a database system are of primary concerns for any database administrator. To facilitate this, system administrators typically make use of various database monitoring tools.
A properly configured database monitoring regimen has a number of benefits. For example:
- Proactive monitoring is always better than a reactive approach. It’s best to identify any warning signs before they become major incidents.
- When apps malfunction or crawl to a snail’s pace, the first place people start investigating (and blaming) is the database. Having database monitoring in place can quickly pinpoint any possible issues and resolve those issues.
- Monitoring is not only about watching performance. It’s also about tracking security-related events, or automatically checking backups—just to name a few.
In this post, we will introduce you to the principles of building an effective database monitoring strategy. We will talk about what type of metrics you should collect, how you can collect those metrics, and a few best practices. We will finish with a simple use case.
There is No Magic Bullet
There is no single model for building a “monitoring strategy.” That’s because more often than not, businesses use different databases, and each one exposes different types of metrics with varying levels of granularity. A critical metric for one platform may not be important for another. Let’s consider the following:
- Relational databases are mostly used in online transaction processing (OLTP) systems
- Data warehouse systems host large volumes of low-velocity data
- NoSQL databases are often used in mobile or web apps to host metadata or status information
- In-memory databases are used for fast performance
Metrics from each of these categories will be further affected by:
- Vendor software (e.g. SQL Server vs. Oracle, MongoDB vs. Cassandra, Redshift vs. Greenplum)
- On-premise vs. cloud-hosting
- If cloud-hosted (if the database is managed or non-managed [e.g. RDS vs. EC2])
- If on-premise (if the hardware is physical or virtualized)
Listing each metric for every combination of the above is impractical. Therefore, one or more overarching categories that can be mapped to individual cases is necessary.
What Database Metrics Should be Monitored?
We will now list a set of generic categories. Under each category, we will list a few types of database metrics you should consider monitoring. This is not an exhaustive list, but we emphasize these because together, they paint a complete picture of the database environment.
Infrastructure
Infrastructure should be part of any database monitoring. The metrics should include:
- Percent CPU time used by the database process
- Available memory
- Available disk space
- Disk queue for waiting IO
- Percent virtual memory use
- Network bandwidth for inbound and outbound traffic
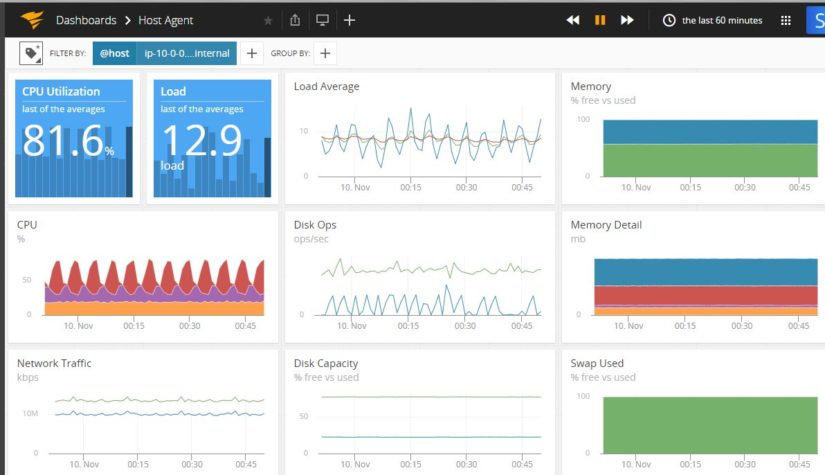
If the metrics are above or below the acceptable threshold, we recommend relating the figures to database metrics as well. That’s because hardware or network-related events like a full disk or a saturated network can reflect in poor query performance. Similarly, a database specific issue like a blocked database query can show up as a high CPU use.
As the image below shows, a properly configured monitoring tool should be able to present a bird’s eye view of the infrastructure at any time:
Availability
The next thing to monitor is database availability. That’s because you want to ensure the database is available and accessible before looking at any other counters. It also saves you from customers complaining before you find out an outage. Metrics can include:
- Accessibility of the database node(s) using common protocols like Ping or Telnet
- Accessibility of the database endpoint and port (e.g. 3306 for MySQL, 5432 for PostgreSQL, etc.)
- Failover events for master nodes or upgrade events for slave/peer nodes in multi-node clusters
Throughput
Throughput should be measured to create normal production performance baselines. The actual metrics for this category will vary between different database platforms, but there are some common ones.
- Connection wait time for database endpoints
- Number of active database connections
- Number of read queries received or in progress
- Number of insert, update, or delete commands received or in progress
- Average time to complete a read query
- Average time to complete insert, update or delete commands
- Replication lag between primary and secondary nodes
- Number of completed transactions
- Percent growth of data and transaction log size
- Percent of times in-memory data cache is accessed
- Heap memory used
To create performance baselines, throughput metrics should be collected during different workload periods and reported in specific time scale (e.g, per minute). The collection process should repeat a number of times.
For example, collecting metrics during month-end batch processing or Black Friday sale events over three to four cycles can provide insight into a system’s health during those periods. These may be different from after-hours operations or weekday sales events.
As baselines are built over time, they can be used to create acceptable thresholds for alarms. Any large deviation from usual values would then need investigation.
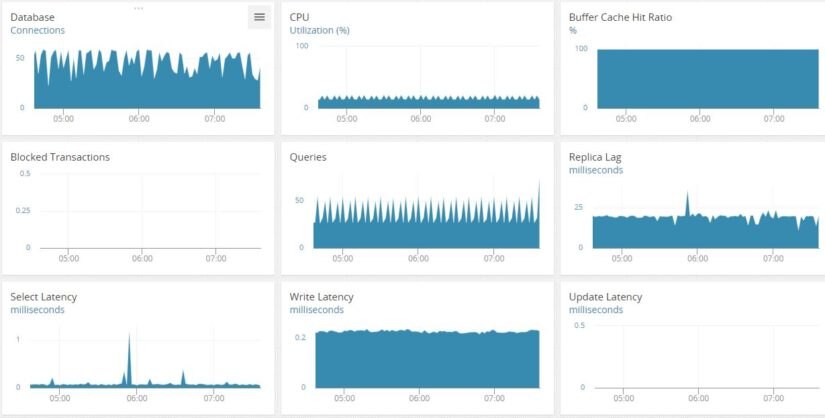
As an example, the following image shows a dashboard for an RDS MySQL cluster with some of the throughput metrics. From here, it will be very easy to see any sudden spikes or dips from the normally trending values.
Performance
Like throughput, performance counters will vary between different databases and should be reported in a specific time scale. These metrics can indicate potential bottlenecks and we recommend creating baselines for these as well. The common ones include:
- Number of read or write queries currently waiting or blocked
- Percent of times disk-based virtual memory is accessed
- Number of database lock timeouts
- Number of deadlocks
- Queries running slower than a set threshold
- Warnings raised for out-of-date statistics or unusable indexes
- Skewed data distribution in nodes
- Application traces
A good monitoring tool should allow you to drill down on reported metrics. For example, a query plan should be “clickable” to further expose the indexes or joins chosen by the query optimizer. This type of performance drill down is typically best done by monitoring tools that ship with the database product.
Sometimes third-party monitoring tools can also show these in an easy-to-understand fashion. The image below shows one such list of metrics for MySQL:
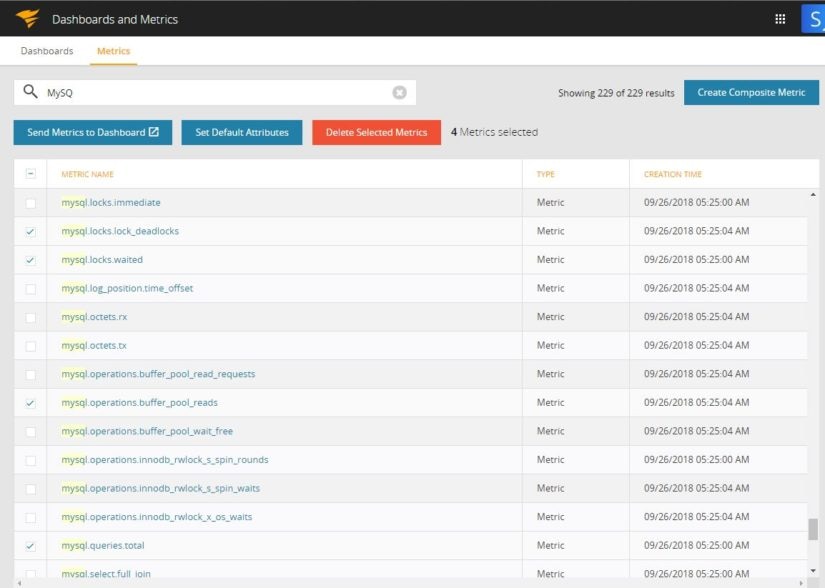
A good monitoring tool should allow you to create composite metrics from those that are available.
Scheduled Tasks
Databases often run repetitive tasks as scheduled “jobs”. Some systems like Microsoft SQL Server or Oracle have built-in job scheduling facilities, while others use cron or third-party schedulers. Some examples of scheduled jobs include:
- Full and incremental database backups
- Database maintenance tasks like vacuuming, reindexing, analyzing and updating statistics, database integrity checks, log rotation, compaction, etc.
- Application-specific tasks like nightly data loads and exports, archiving, etc.
Regardless of function, scheduled tasks’ outcomes (success or failure) need to be monitored.
Security
Database security monitoring has to be aligned with enterprise-wide security initiatives and goals. At a minimum, we recommend monitoring the following:
- Number of failed login attempts
- Database configuration change events
- New user account creation
- Password changes
DBAs don’t need to monitor each individual event, but it’s still important to look at the aggregated values of these events. All these metrics should be very small during normal operation. It should become a concern only when there are large spikes in those aggregated figures. For example, hundreds of failed login attempts should trigger an alarm. While this may not necessarily mean an intrusion, it still requires attention.
Logs
Every database engine has some type of log where it records information. This log can be made up of one or more physical files. A monitoring tool should be able to collect, parse, and store these logs and create metrics and dashboards from the events they expose. Log management is one of the core requirements of database monitoring because logs can contain invaluable information like:
- Database system events (startup, shutdown, errors, etc.)
- All user and system queries
- Scheduled jobs’ outputs
How to Capture Database Metrics
There are a number of sources available for collecting database metrics. A monitoring solution should make use of the following:
- Metrics natively exposed by the database engine. These metrics can be accessed from:
- Querying database system tables and metadata
- Running database commands
- Calling extended procedures or APIs
- Metrics exposed by the operating system. These are typically related to the underlying infrastructure or resource usage.
- Metrics exposed by third-party tools and add-ons. For example, if a vendor’s tool is used for database backups, API calls to the tool may expose success or failure of backup jobs, percent space available in backup storage.
What Tools to Use
The real value of a great database monitoring tool lies in its ability to capture, store, and analyze metrics and events and presenting the operational intelligence from it in a meaningful way. When it comes to choosing a monitoring tool, again, different options exist:
- Some database engines natively come with their own monitoring tool (e.g., Oracle Enterprise Manager).
- Some database software comes with monitoring as an extra value-added product.
- Sometimes commercial distributions of open-source databases have extra monitoring available.
- Sometimes DBAs use home-grown scripts and tasks to capture performance metrics and build their own dashboards. Often these are made available in public repos like GitHub.
- Infrastructure monitoring and logging tools can offer “plugins” for different databases.
- Enterprise-grade Application Performance Monitoring (APM) tools also have hooks and plug-ins for databases.
Although companies most often use one or more of these in combination, monitoring becomes much easier if only one tool is chosen. A great database monitoring tool should be able to:
- Collect and store core database metrics and logs discussed above
- Operate without much maintenance from the customer’s side (e.g., the disk of the monitoring server itself filling up or monitoring agents adding to the internal network traffic)
- Use lightweight agents or short probes to collect data
- Have a wide range of plugins and hooks that are actively maintained
- Correlate log events with performance metrics from database, OS, etc.
- Drill down on events or queries
- Create dashboards containing metrics and logs
- Fire off alarms when performance thresholds are crossed
- Send automated notification to groups of users through popular channels like Slack or PagerDuty
- Automatically create tickets in incident management systems
There are tools in the market which can fit most of these requirements. Unfortunately, not every tool can be used for every combination of databases. As a best practice, enterprises should perform due diligence in finding the tool that best meets their requirements and budget.
Troubleshooting Database Performance Problems
SolarWinds® AppOptics™ is a Software-as-a-Service application performance monitoring tool. Among other things, AppOptics offers distributed tracing. This means it can measure and monitor the performance of application stacks in each component layer. This includes network, database, API, UI, etc.
To help troubleshoot database performance problems, developers can use a feature called “Traced Queries”. With traced queries, AppOptics can drill down on any one database query and identify the application calls that are causing poor performance.
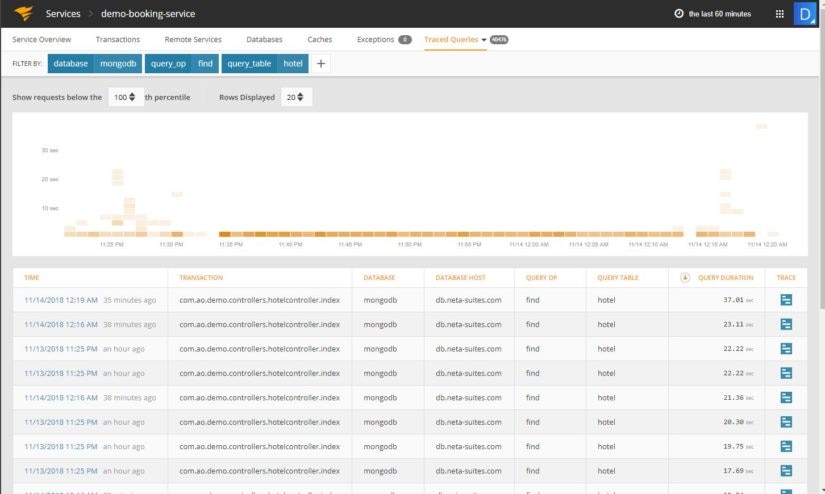
The image below shows the database performance profile tab of a web service. A filter is applied for the database (MongoDB) and the query operation (find).

The query performance overview pane shows one of the queries running frequently and taking more than 300 milliseconds to complete on average:

A user can click on the “Trace” icon beside this query. This will take the user to another screen which will show every application transaction that ran this query and the time taken by that transaction. The results will be arranged in reverse chronological order:
Clicking again on the trace icon for a transaction will display the API operations of the service. From there, it’s possible to see the query’s performance compared to other components in the call:

Clicking on the most expensive component (mongodb in this case) opens up another screen with the details of the query:
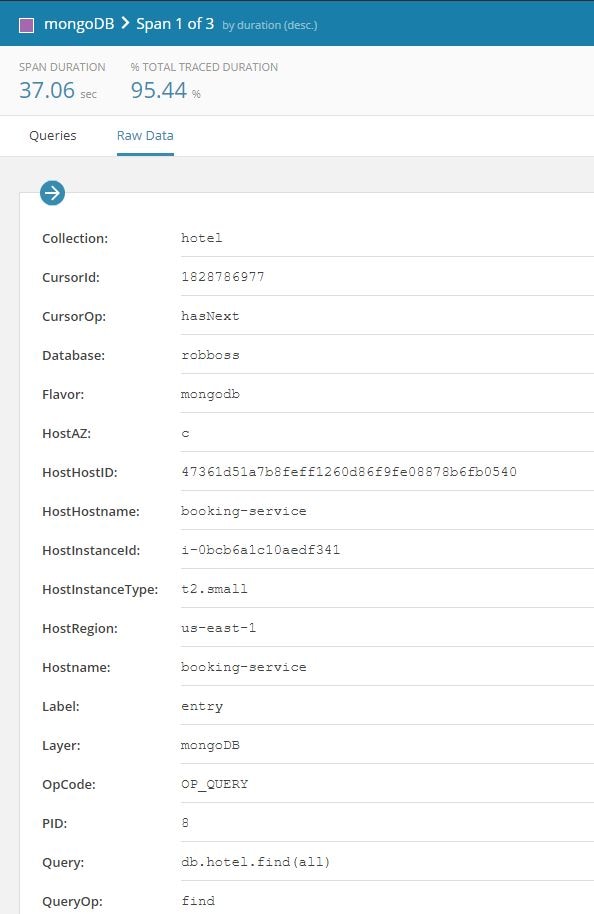
The reason why the operation is taking a long time can be seen here: The query is returning all the rows from a collection.
As another example, to see how AppOptics can help monitor MySQL databases, read this article on Troubleshooting MySQL Performance Issues with SolarWinds AppOptics.
Final Words
With the basics of developing a broader database monitoring strategy now covered, it’s time for you to move into a more detailed design. We recommend you start by mapping the generic metrics listed in this article to each of your databases. At the same time, you need to decide on which tool to use.
As we saw, SolarWinds® AppOptics™ makes it easy to monitor databases both from the infrastructure and the application layer. You can take one of your databases for a test drive by signing up for a free 30-day trial.