To read part I, click here.
7. Enable Caching
Caching can dramatically improve your database performance. Without caching, your application can be slowed down due to excessive database calls. Some types of caching can cause performance issues due to the configuration (like distributed caches). When should you use a cache?
To determine if you need a cache, look at your database query performance. AppOptics makes this easy by providing a Databases tab, available from any detail page for your service:

From the Database page, you can see all queries executed by your service:

For the code above, we identified the issue as an N+1 Select Problem. Even with an optimized database query we can still improve performance significantly. The example here uses a small data set, but what if you had millions of Person and Address instances?
Using the “SQL Database Query Overview” above, we can see which queries are running and where a cache can be helpful. If you only have one instance of your application in production, and your queries are taking too long to complete, a local cache will dramatically improve performance. If you have multiple instances of your service running in production and all the data is immutable, a local cache should be sufficient for each service. If your data is mutable, then a distributed cache may be a better solution. AppOptics also provides a Caches screen to give insight into how often your cache is accessed.
8. Troubleshoot Database Activity
You’ve optimized your queries and added caching where appropriate—what else could go wrong? Like any system, each database implementation behaves differently than its peers. Queries or database mappings that work great in MySQL may work completely differently in PostgreSQL. Understanding how your applications impact your database in production is key to managing your system’s performance.
The best way to understand how your application is impacting the database is to closely monitor how your database behaves under load. Coupling tools like AppOptics and AppOptics infrastructure monitoring can provide you with deeper insight into what’s happening with your system.
Correlating a spike in database CPU usage with a long-running query can help right-size your database server. You may need to optimize your server for high CPU or high I/O, but you won’t know for sure until your system has been running and you see how your application queries impact the database.
Infrastructure
9. Look for High CPU Usage
This is an easy metric to track using host monitoring. You want to see what percentage of the CPU is consumed by your application. Most web applications don’t consume a lot of CPU and they tend to be bursty in nature. Long-running, processing-intensive services will consume more CPU in part because the service is running for a long time. On the other hand, web apps respond to an event and return immediately.
For example, imagine a Java application that schedules classes for students; it takes several minutes to run and will repeat the scheduling algorithm over and over. This application will take much more CPU than a typical web app. It’s important to understand the characteristics of your application when monitoring its CPU usage.
If you’re running a web app and you have high CPU, you can use an infrastructure monitoring tool like AppOptics to notify you when your host hits a specific CPU max, say 80% utilization for more than five minutes. (You’ll need to tweak these parameters based on your application’s characteristics.) High CPU for a web app is usually triggered by excessive GC, poorly written algorithms, or too many threads. High CPU can also be triggered by things like background processes (such as cron jobs) or incorrectly-sized hosts. In one instance, I’ve seen an anti-virus tool consume so much CPU that an autoscaler started another host because the application’s host wasn’t responsive.
High CPU is a coarse-grained but very useful indicator something is wrong with your application and/or host. High CPU is a starting point and possibly an indicator you need to analyze your application further.
10. Analyze Network Latency
When you trace remote calls in AppOptics, you’ll get a better idea on how long remote service calls are taking. Whether you’re running in the cloud, building out a microservices architecture or deploying services to a Kubernetes cluster, chances are that your application relies on other services to complete its tasks. More than ever, the fallacies of distributed computing are a reality for just about every application you write or deploy.
AppOptics provides you with a detailed view of all remote services called by your service (in the screenshot below, all the remote calls are taking way too long):
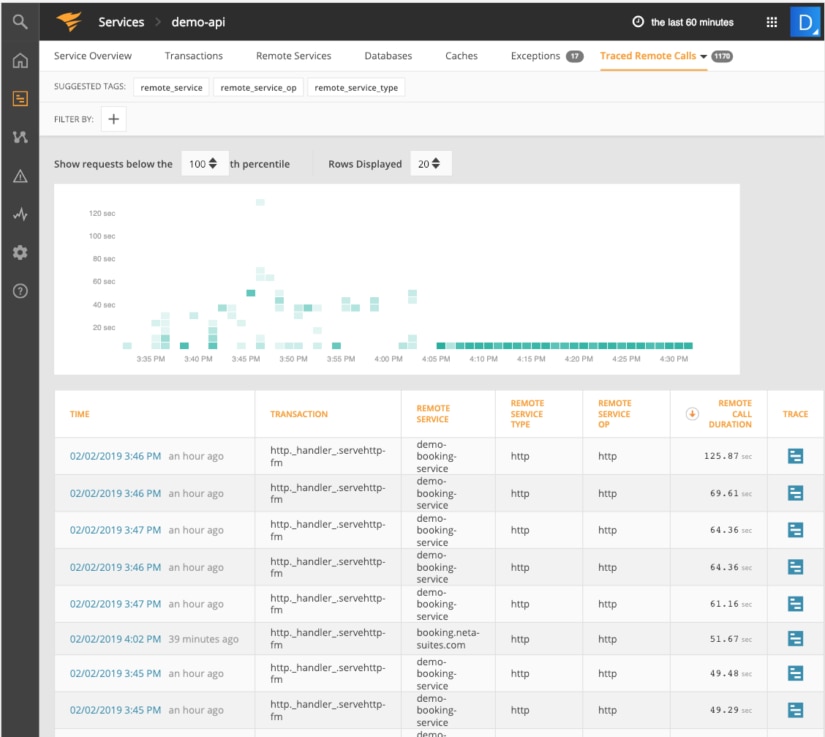
Calls to the demo-booking-service are taking more than two minutes to complete. Drill into the endpoint to see why it’s taking so long:
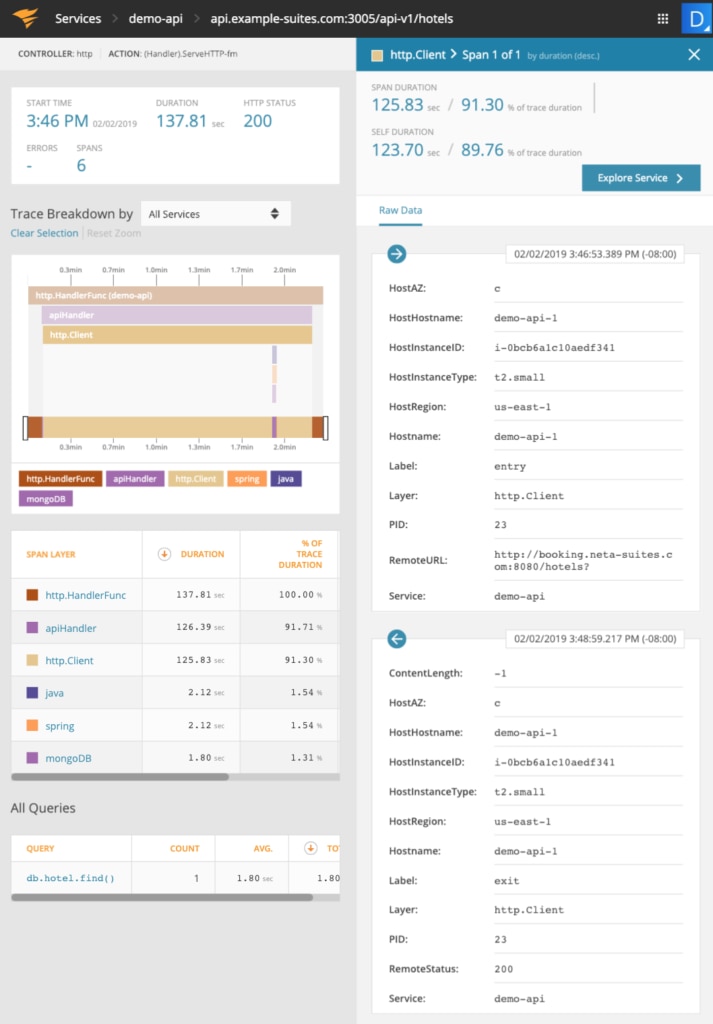
In the screenshot above we can see that 91.3% of the endpoint’s time was spent calling hotel endpoints. It appears this time was spent waiting in the networking stack since the remote Java service returned fairly quickly once the request was processed.
Since you’re sharing the network with other services, it’s important to monitor your network to make sure it’s configured correctly and to make sure one service isn’t starving other services due to its high network usage.
Summary and Next Steps
Many common Java performance tuning scenarios were covered—some can be easily prevented while others require some deeper analysis. Starting with a mindset oriented to optimizing Java is the first step to improving your application’s performance. Being aware of various gotchas in Java will help you write better code and prevent unexpected performance issues. Adding AppOptics to your service, while it’s running in production, will give you deeper insights into exactly what it’s doing.
What performance problems have you experienced that were difficult to pinpoint? Try AppOptics for free for 30 days and test its powerful insights against your most difficult problems and see what insights it helps you uncover.