
Tracking down performance issues in Java applications is difficult. Is the call to a remote service taking too long? Are your database queries running efficiently? Are you creating too many temporary objects? There are many different reasons for why your Java application isn’t performing as expected. I’ll give you some tips on common performance issues in Java applications.
Performance is key for any system. In a microservices architecture, your service may interact with other services and various infrastructure components. And every one of these integrations can negatively impact your service. Being able to drill down into each system and view timing metrics for database access, remote system calls, or time spent in a method are key for managing and improving the performance of your overall system. Knowing if it’s your code, a database query, another service, or time spent in a framework enables you to know where to focus your attention. Each of these performance issues is covered below, in the context of a Java application and how it interacts with other systems.
Here are 10 common Java application performance tuning opportunities, organized into three groups: application layer performance, database layer issues, and infrastructure related issues.
Measuring Performance
The first task when investigating performance problems in your system is to measure performance. Analyzing several types of metrics will give you clues to the root cause of the problem and what can be most effectively optimized. You’ll want to look at infrastructure metrics to rule out constraints due to your hosting or runtime environment. This is an extensive topic, so check out our eBook The Complete Guide to Infrastructure Monitoring.
We’ll assume you’ve already considered the infrastructure and now you want to measure and optimize your application code. In the article we used SolarWinds® AppOptics™ to demonstrate how to measure Java performance. AppOptics provides you distributed tracing, overall metrics on your application like HTTP status codes, top methods and hosts your application is running on, database tracing, cache usage, exceptions thrown, and traced requests. Below, you can see a Java service based on Spring that makes several remote service calls, and how long each one took.

In the next section, we’ll share how your APM tool can help diagnose performance problems and how to improve your application.
Application
1. Identify Thread Deadlocks
If you’re running a multithreaded application and notice slow response times due to blocking calls but low CPU and IO usage, you might want to investigate your threading. Since its inception, Java has always provided a rich set of features for concurrent programming. With all the tools at your disposal, it’s still common to run across deadlock code. A deadlock occurs when two threads try to obtain a lock on a resource that’s already locked. Here’s a very simple example of how to trigger a deadlock:

The output from the program is:

Note how if Thread 1 acquired a resource and Thread 2 acquired a different resource and then they both try to lock on each other’s resource, they’ll wait forever. In this case, you can resolve the problem by accessing the locked resources in the same order. That means both methods should first lock on resource1 and then resource2. Notice how Thread second reverses the order from Thread first. How do you find a deadlock? You can use the jstack command to get a thread dump. If you have a deadlock, it’ll show up in the thread dump (at the bottom):

2. Examine HashCode() and Equals()
As pointed out here, a poorly written hashCode()method can
dramatically impact your memory footprint as well as your application
performance. Problems like these can manifest themselves in odd ways in
production; the JVM can run out of memory unexpectedly or your web service
endpoint performance may degrade over time.
The Object class outlines the contract between equals() and hashCode()—“equal objects must have equal
hash codes.” When working with hash-based collections like HashMap and HashSet,hashCode(is used. Every time an
object is inserted, removed, or looked up in a hash-based collection, hashCode()is invoked. If there’s a hash collision, equals() is used. From the Java SE 11 docs—“Many methods in Collections
Framework interfaces are defined in terms of the equals.”
To ensure the contract between equals()and hashCode()is maintained, you can use a
testing library like equalsverifier. Additionally, be sure both
methods are performant and don’t cause any unintended side effects.
3. Find Excessive Garbage Collection
If you notice sporadic spikes in response
time, you might want to see if it lines up with garbage collection times.
Garbage collection (GC) is designed to make your life as a software engineer
easier, not harder. However, since you may not know when the garbage collector
will kick in, it can cause unexpected side effects, specifically slowing down
your application when you least suspect it. GC-related errors can be difficult
to track down. To track down GC-related activity, use the -verbose:gc Java option.
As a general rule of thumb, GC should take less than 10% of your CPU processing time; more than 20% means you have a memory issue with your application.
To get insight into the GC activity of your
application, you need a JVM heap analysis tool like jmap. However, you need to run jmap on the same host as your application. What if you don’t have direct
access to the host? An APM tool like AppOptics can provide this information.
AppOptics provides a Java agent that you include with your java application and enable with the java command line option -javaagent, like this:
java -javaagent:appoptics-agent.jar -jar my-app.jar
Using the AppOptics dashboard, you can plot various application metrics beside one another. In the image below, we can see a spike in the demo-web-tier corresponds to a spike in GC Collection time. More than 40% of the total execution time of demo-web-tier (423.94ms) was spent in GC (~100ms).

In order to better understand the role of GC in the performance of your web service, you’ll want to use a longer sample of data.
4. Beware of Inefficient Logging
If you’re running a CPU or IO-bound application, you need to investigate every operation and eliminate the inessential ones. It’s often said you should use a debugger instead of logging to identify and resolve issues in code. While that may be true in a development or testing environment, I often find myself adding log statements to my code to get a better understanding of code execution when dealing with production traffic.
However, be wary of too many logging statements in your code as they add a small amount of additional processing time, create a great deal of noise in the log file, and can make your output meaningless. To make things worse, I’ve seen this sort of verbose logging cause out-of-disk-space issues in production when the system is improperly configured.
Here are a couple of ways to improve Java performance when logging. First, be cautious of extraneous object creation, specifically String object creation. Consider this java logging statement:
logger.debug (“User name: `“ + user.getUsername() + “`”)Multiple String objects are created every time this line of code is executed. That could mean millions of unnecessary objects being created. The popular Java logging framework, Simple Logging Facade for Java (SLF4J), suggests using parameterized messages instead:
logger.debug (“User name: `{}`“, user.getUsername());No additional objects are created in the process. This will perform much better than the first logging statement above. Can you make this even faster? Yes. Another common suggestion is to guard calls to the debugger before you actually log. Should you guard all calls to the Logger? No. However, if you are invoking an expensive operation, adding a guard can improve the performance of your method. Here’s the same logging statement with a guard:
if (logger.isDebugEnabled()) {
    logger.debug(“User name: `{}`”, user.getUsername());
}
Here we’re combining both approaches to guard the call and then make the call to debug as efficient as possible.
Database
Object Relational Mapping (ORM) frameworks like Hibernate and other JPA implementations make it easy to fetch data from a database and map it into a Java Object. When you have a simple mapping of one database row to one Java Object, the configuration is straightforward, and the performance is typically quite good. When you introduce relationships between Objects things get a bit trickier. This next section looks at how to optimize your ORM framework usage.
To give some context to the discussion below, here’s a simple object model. There are two Java Classes: Person and Address. This object model maps multiple addresses to a single person.

5. Tune Your Relationship Mapping
When your database response times are slow, make sure you’re loading relationships efficiently. With @OneToMany and @ManyToMany relationships, the mapping can be eager or lazy, with the default being lazy. Eager will fetch the collection when the primary object is fetched and lazy only fetches the collection when it’s accessed directly. One of the most common issues I’ve run into is when the @OneToMany relationship is eager. While this fetches all the data you’ll need with one JPA or Hibernate call, it may generate more database activity than expected. I find the best way to know exactly how your mappings are translated into SQL is to turn on SQL logging (only in development, never in production, since it generates a significant amount of logs). It’s a simple suggestion, but this will help you understand how to find and fix the rest of the issues below.
6. Improve Your Queries
As suggested above, turn on SQL logging for your application. You need to know what’s happening before you can fix it.
An extremely common database issue is the N+1
select problem. This is when your application executes N+1 queries to fetch all
data, one query to get all Person instances,
and N queries to fetch each Address instance for each Person.
Using the Person/Address object model above, here’s
how you might define the Person to Address relationship:

Hibernate will generate one query to get the Person instance and multiple queries to get each Address instance. Even if you thought you mapped this correctly, you may not know which queries were being executed if you hadn’t turned on SQL logging.
Here are the queries generated for the above mapping:
Hibernate: select addresslis0_.person_id_fk as person_i5_0_0_, addresslis0_.address_id as address_1_0_0_, addresslis0_.address_id as address_1_0_1_, addresslis0_.city as city2_0_1_, addresslis0_.date_created as date_cre3_0_1_, addresslis0_.date_updated as date_upd4_0_1_, addresslis0_.person_id_fk as person_i5_0_1_, addresslis0_.state as state6_0_1_, addresslis0_.street as street7_0_1_ from address addresslis0_ where addresslis0_.person_id_fk=?
Hibernate: select addresslis0_.person_id_fk as person_i5_0_0_, addresslis0_.address_id as address_1_0_0_, addresslis0_.address_id as address_1_0_1_, addresslis0_.city as city2_0_1_, addresslis0_.date_created as date_cre3_0_1_, addresslis0_.date_updated as date_upd4_0_1_, addresslis0_.person_id_fk as person_i5_0_1_, addresslis0_.state as state6_0_1_, addresslis0_.street as street7_0_1_ from address addresslis0_ where addresslis0_.person_id_fk=?
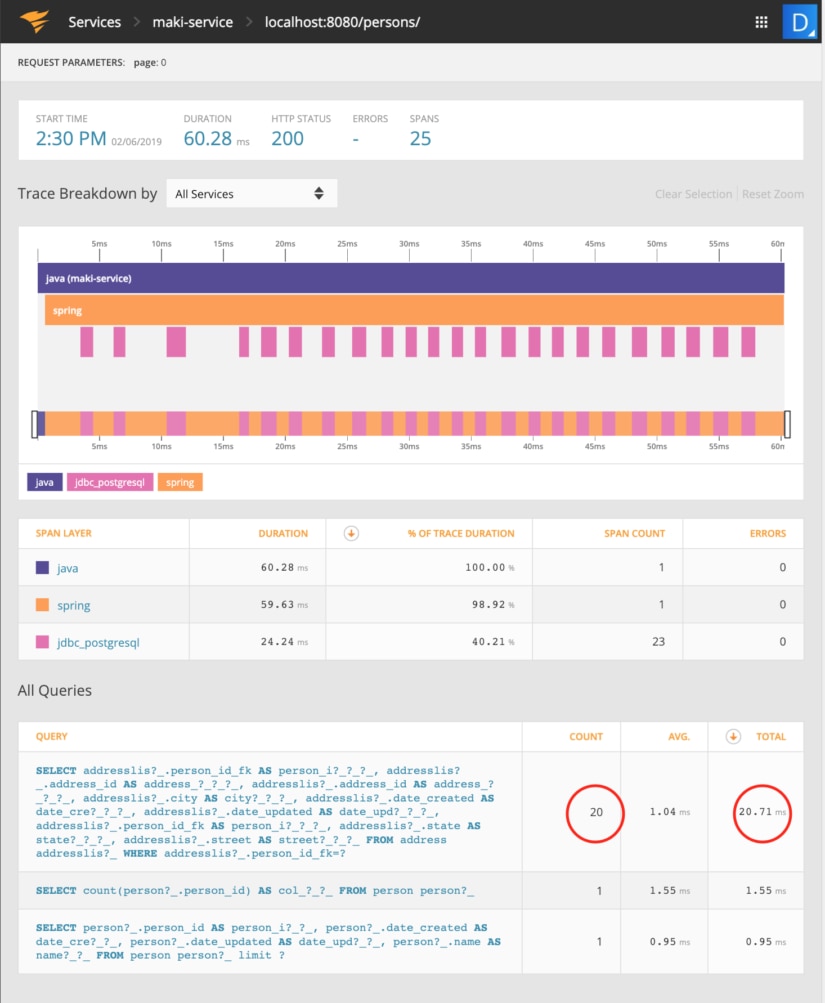
...If you didn’t turn on SQL logging during development, you can still get this level of information by using an APM tool. In the “AppOptics – traced requests” screenshot below, the Address query is called 20 times and the Person query only once. The AppOptics screenshot below highlights the inefficiency of first Person/Address mapping.
To fix this, you can use the @NamedEntityGraph annotation, introduced in JPA 2.1:
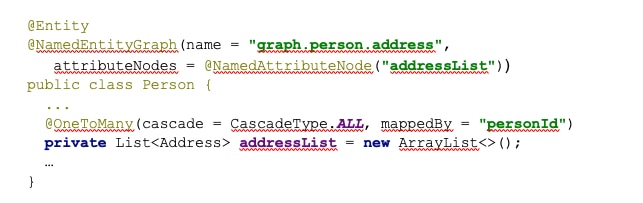
If you’re using Spring Data to fetch your entity, you’ll also need to update your JPA Repository:

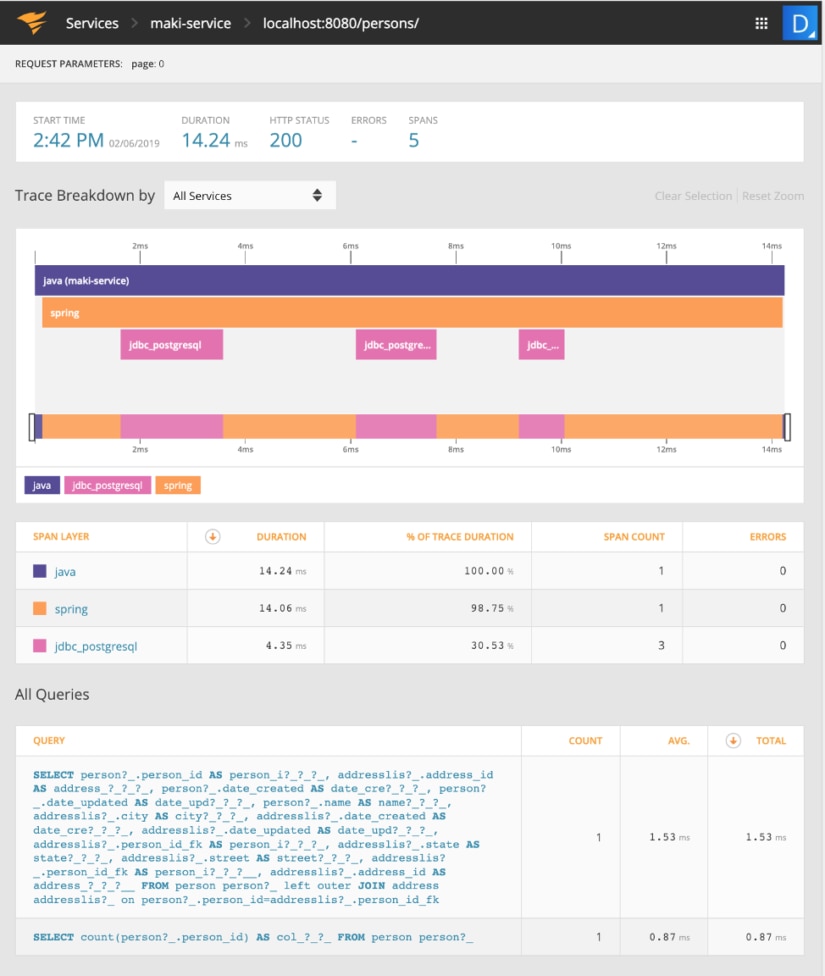
Here’s the improved query, which combines each of the previous individual queries into a single join:
Hibernate: select person0_.person_id as person_i1_1_0_, addresslis1_.address_id as address_1_0_1_, person0_.date_created as date_cre2_1_0_, person0_.date_updated as date_upd3_1_0_, person0_.name as name4_1_0_, addresslis1_.city as city2_0_1_, addresslis1_.date_created as date_cre3_0_1_, addresslis1_.date_updated as date_upd4_0_1_, addresslis1_.person_id_fk as person_i5_0_1_, addresslis1_.state as state6_0_1_, addresslis1_.street as street7_0_1_, addresslis1_.person_id_fk as person_i5_0_0__, addresslis1_.address_id as address_1_0_0__ from person person0_ left outer join address addresslis1_ on person0_.person_id=addresslis1_.person_id_fkThe performance improvement of the new query is clearly visible in the AppOptics Traced Requests. A total of 21 queries have been reduced to one query and the total time spent in jdbc_postgresql decreased from 24.24ms to 4.35ms.
To continue reading, check out Part II here.