The server operating system (OS) is dominated by two companies. Red Hat, the first one, dominates the open-source server market. While Windows, the second one, dominates the closed-source market. According to a 2018 study by T4, Microsoft controls 47.8% of the industry share, whereas Red Hat controls only 33.9% of the market. The remaining 18.3% is controlled by alternative server OSs.
Windows server monitoring has become a hot topic. Monitoring plays an important role in gaining more insights into what’s happening with your Windows server and its overall health,.
This article discusses the importance of Windows server monitoring, explores which aspects are involved with server monitoring, and lists key metrics you should track to get better insights.
Understanding the Importance of and Need for Windows Server Monitoring
Server monitoring allows you to track various metrics about your server. Those metrics can be used to create smart alerts to detect errors or incorrect behavior. In other words, your team can shift from reactive monitoring to proactive monitoring.
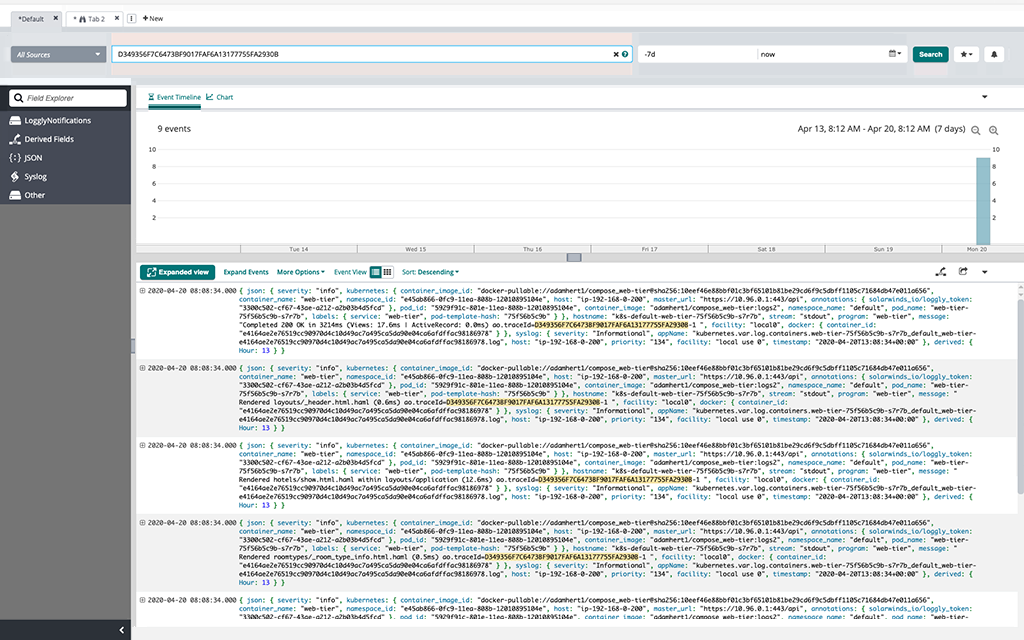
For example, say you’ve created an alert to detect a high number of failed login attempts per minute. Suddenly, your server notifies you of more than 50 failed login attempts during the last few minutes. This allows you to act before a malicious person can potentially gain access to your system.
Let’s say we then blocklist the malicious user’s IP address. This is a prime example of proactive monitoring where we prevent problems from happening. Reactive monitoring would only act when a problem occurs.
On top of that, you can find the root cause of the issue much faster through the insights you’ve gained from monitoring your application. The log data and metrics can tell you what went wrong and when this malicious behavior started.
Next, let’s discuss the aspects of Windows server monitoring.
Aspects of Server Monitoring
Here are four aspects you should think of when implementing Windows server monitoring. The goal of this section is to provide you with best practices to implement monitoring capabilities correctly and efficiently.
Recommended reading: What Is Application Performance Monitoring (APM)?
Define a Baseline
First, you need to define the “normal” performance of your Windows server. You can’t compare your server without knowing your typical server performance on a regular day. Without a baseline, it becomes much harder to detect issues as you have no reference data to compare with.
Furthermore, make sure to measure a baseline for your whole system, not just a single component. In the next section, we’ll use this baseline to create alerts to detect any anomalies.
Set Up Alerts
Next, let’s create alerts. An alert warns you when a pattern has been detected or a value deviates from its baseline. It’s an effective approach to enable real-time monitoring. Furthermore, alerting capabilities help you switch to proactive monitoring as mentioned before.
For example, you can create an alert to track the percentage of CPU usage. You don’t want your CPU usage to exceed 90%. If this happens, you might have some inefficient code or a usage spike. You can further use this metric to automatically scale your application when demand increases based on CPU usage. Moreover, you want to avoid your CPU usage hitting 100% as it can slow down your application and users’ requests.
So, now that we have alerts, let’s look at using automated tools to reduce your monitoring workload.
Reduce Work Using Tooling
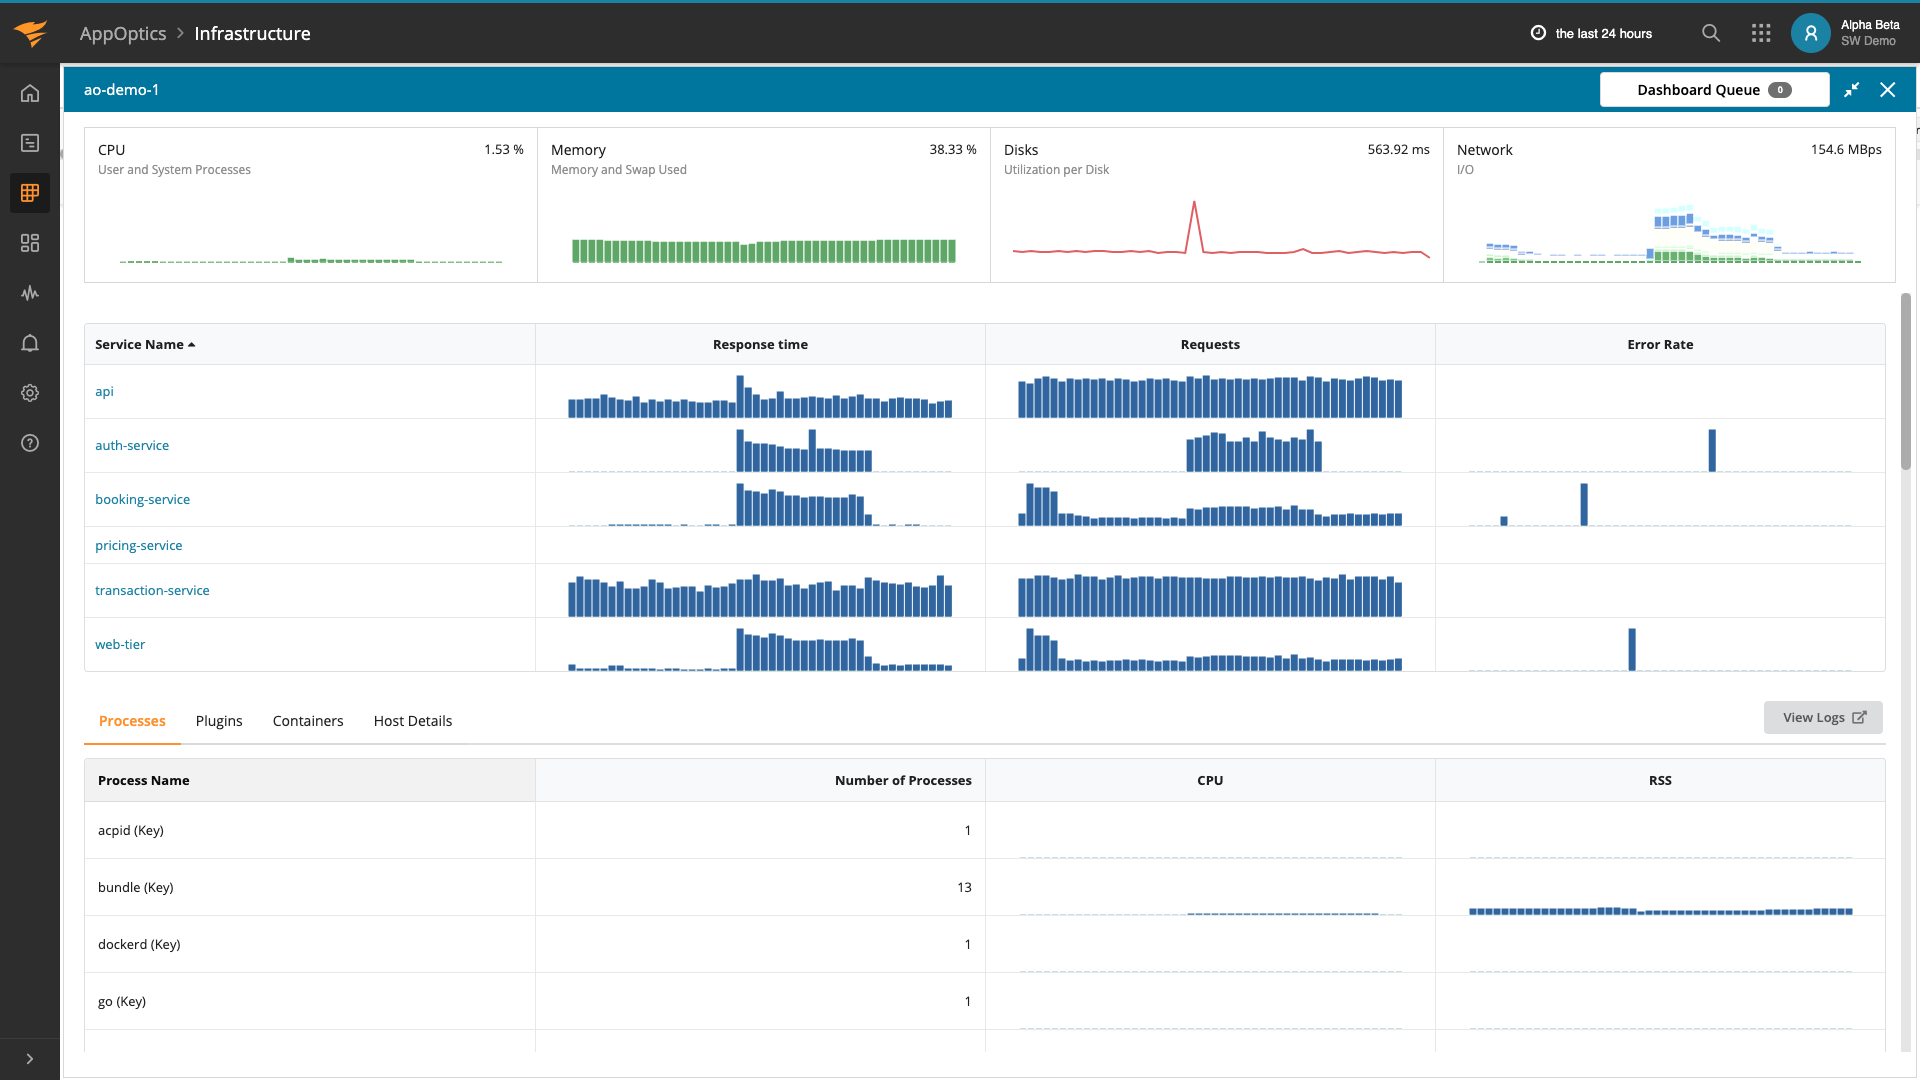
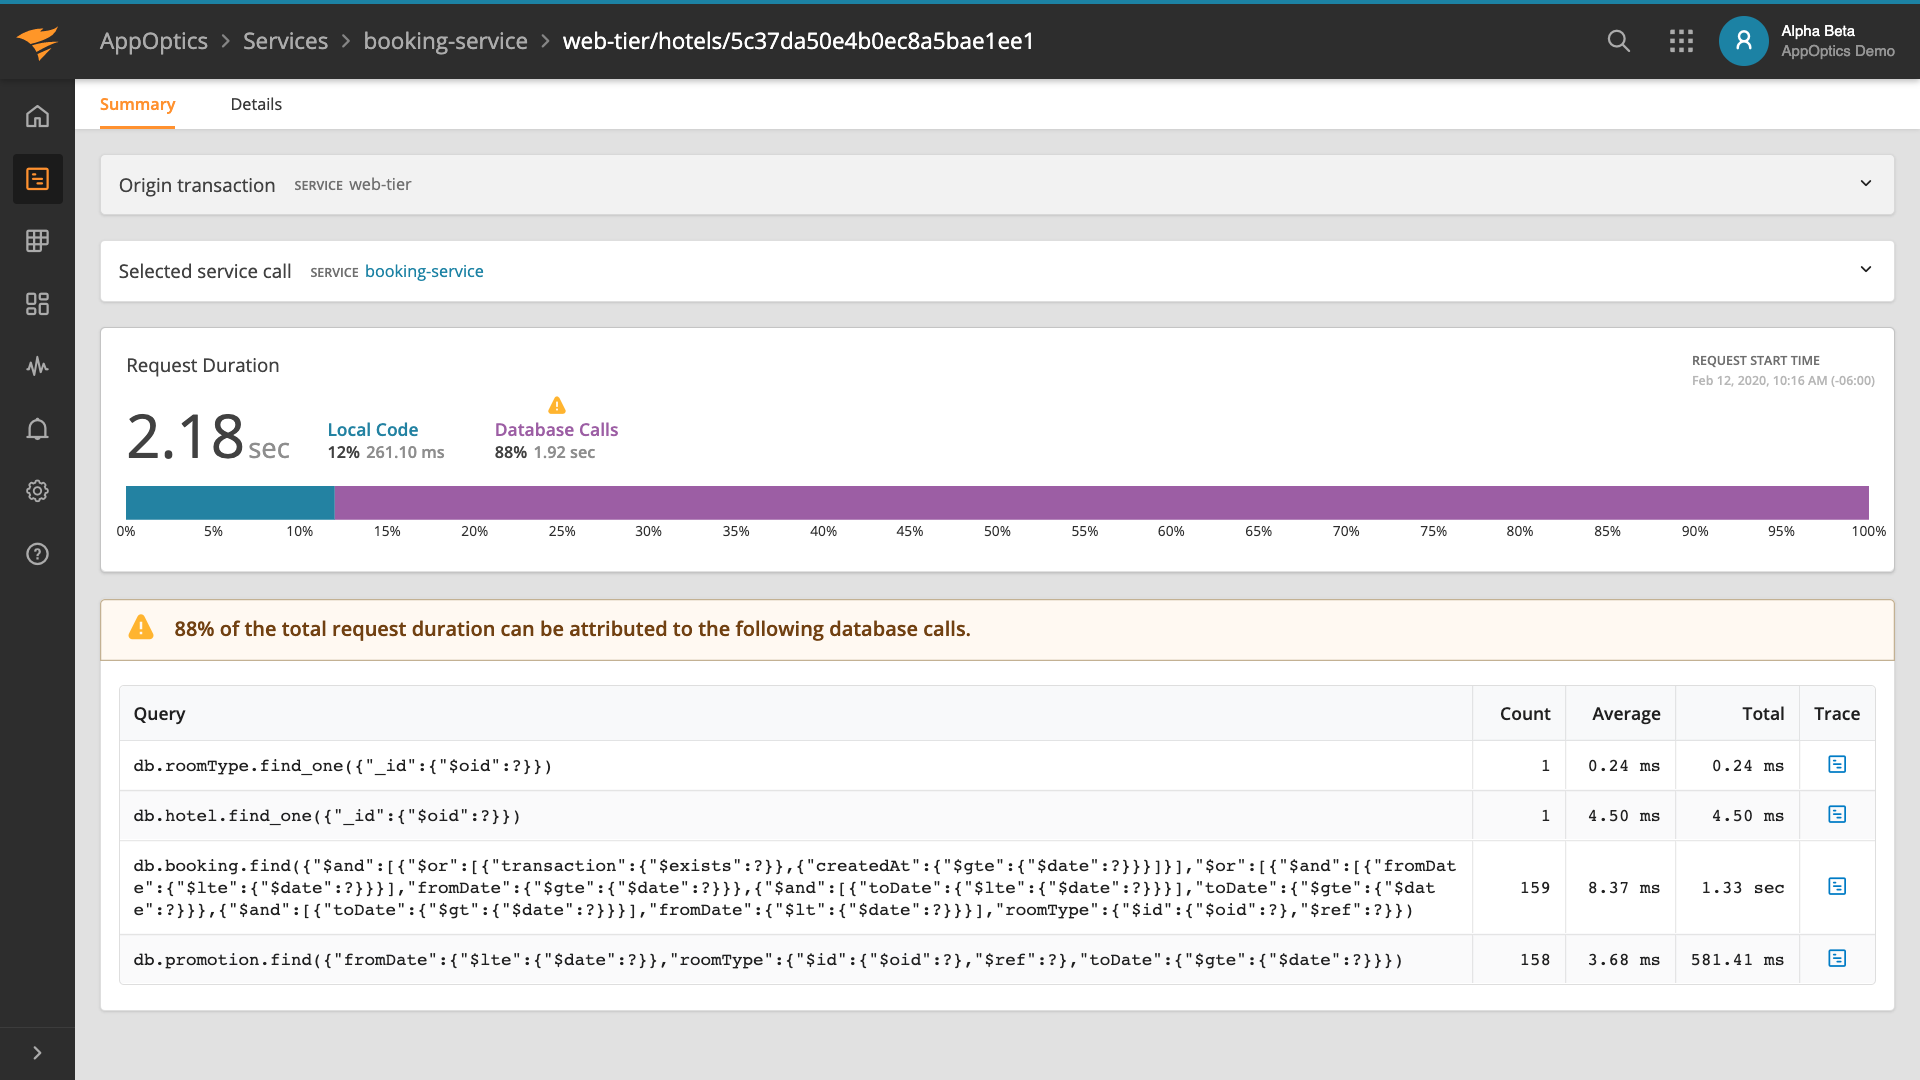
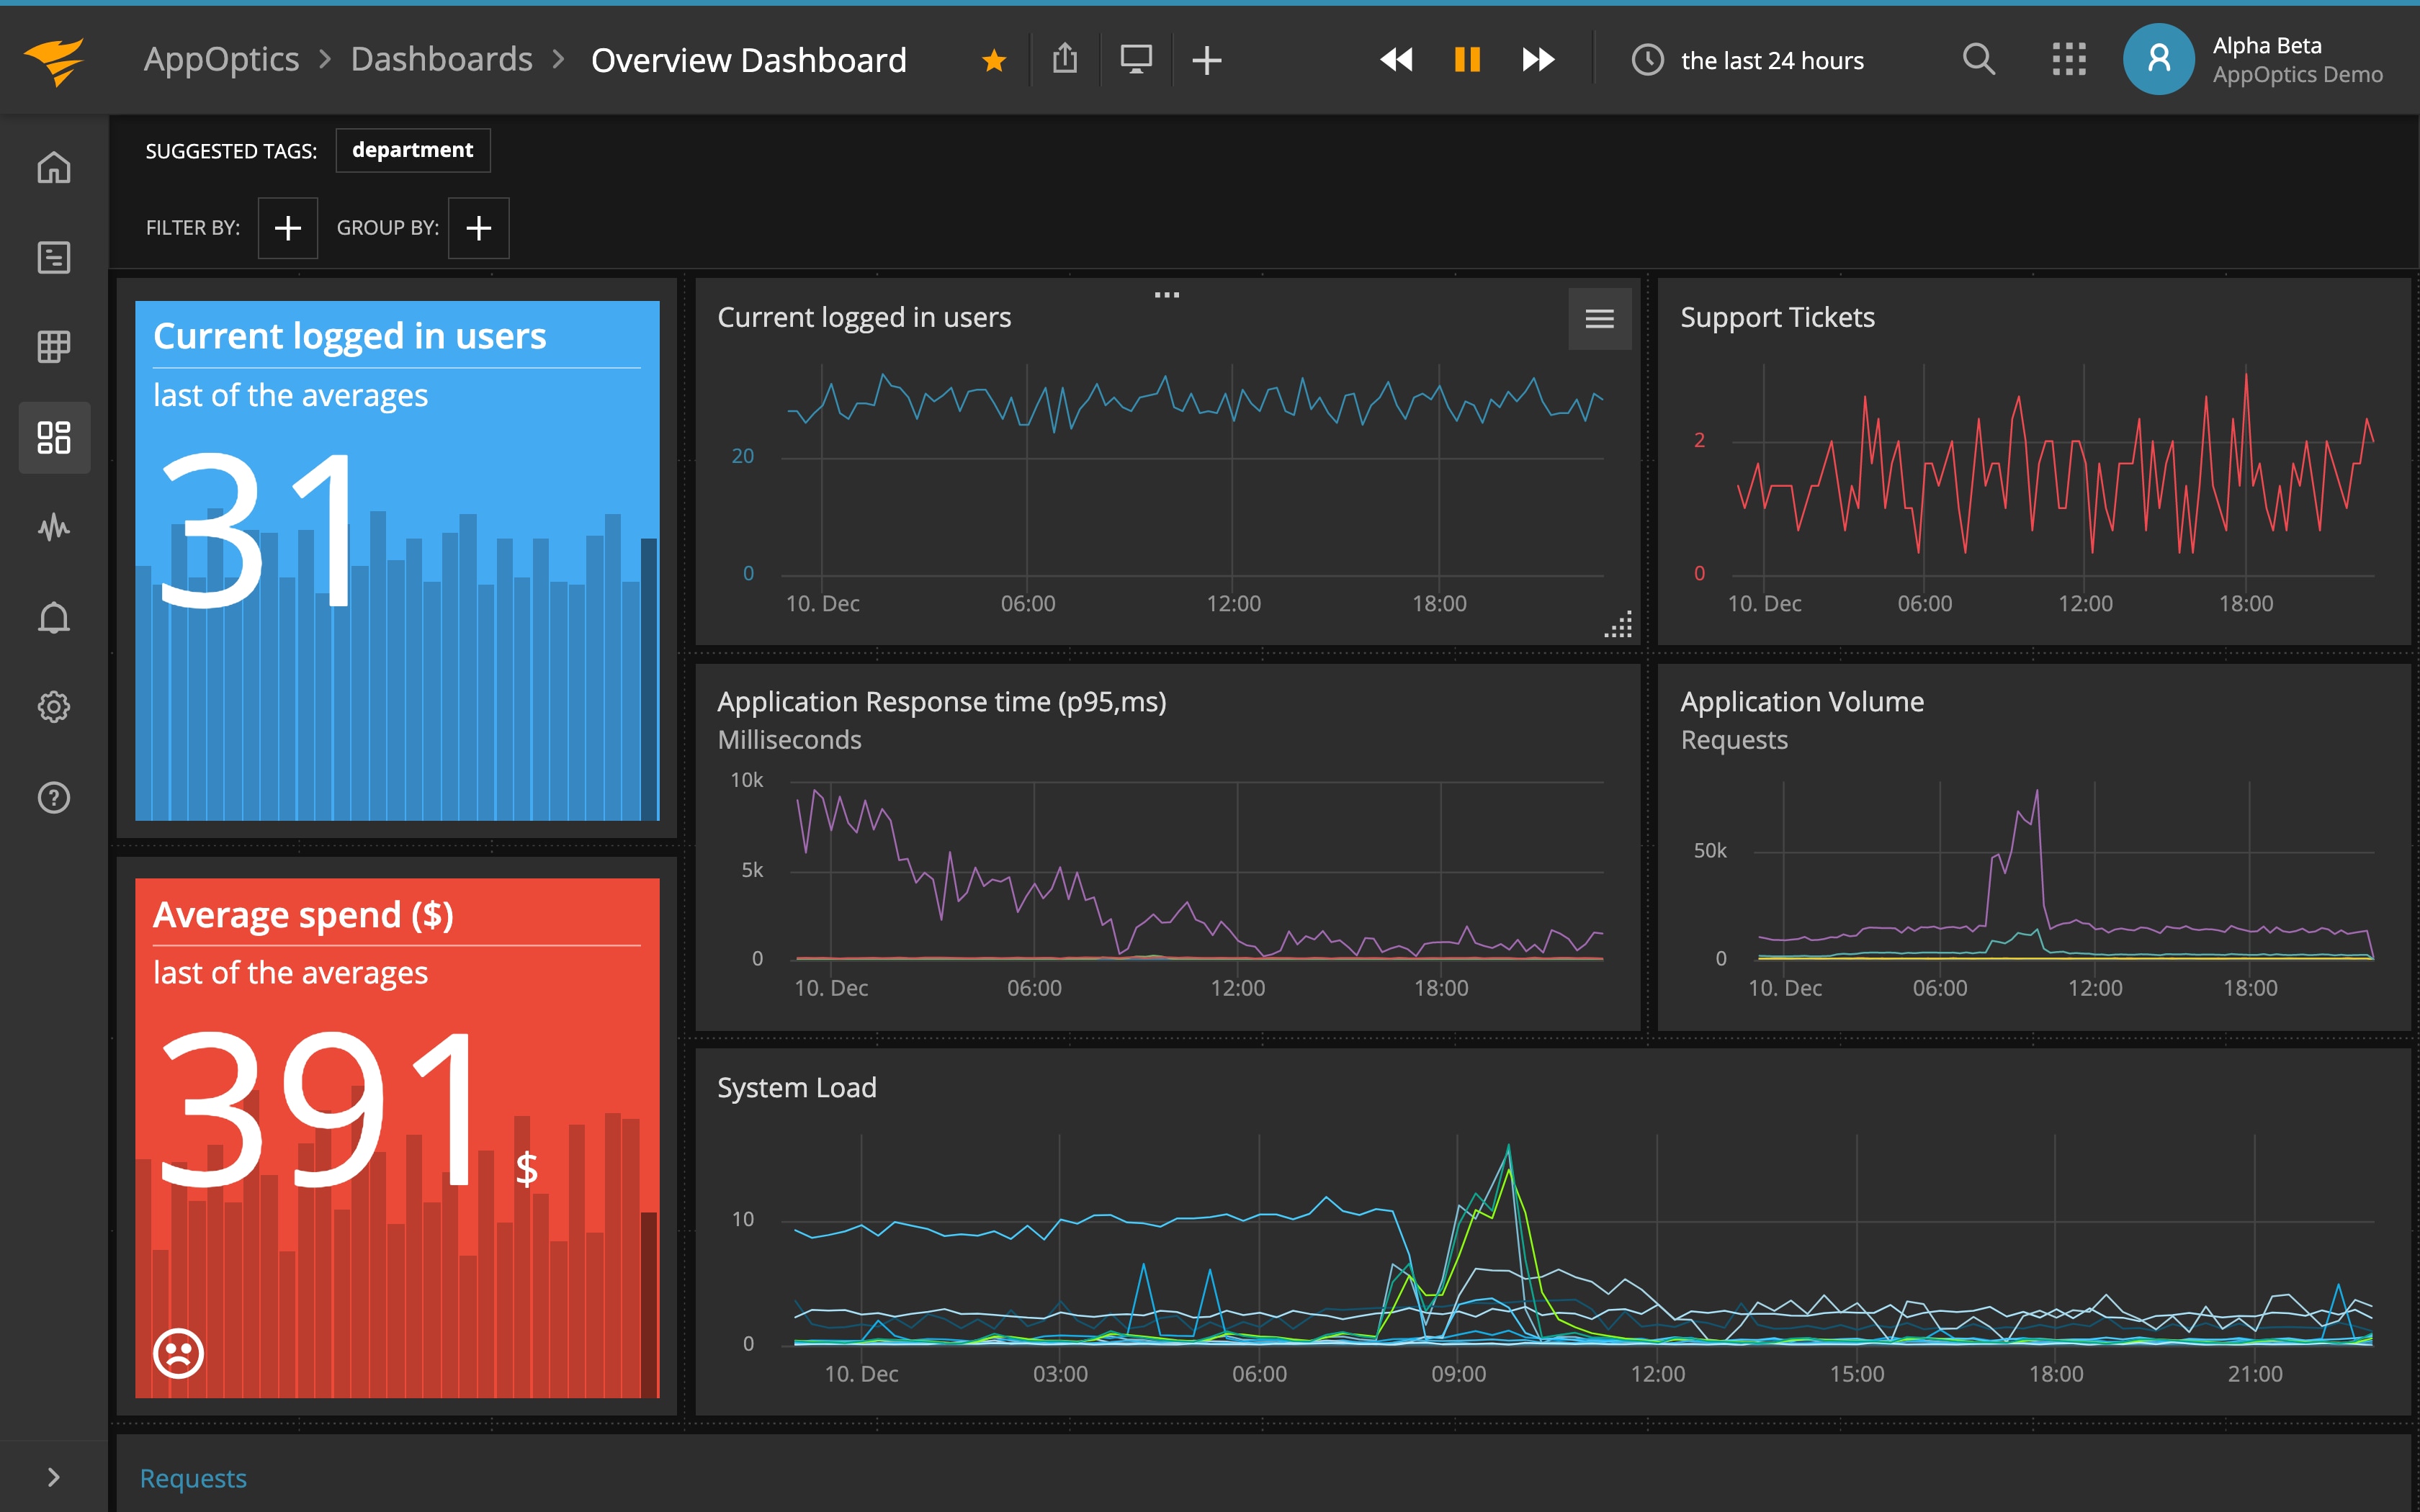
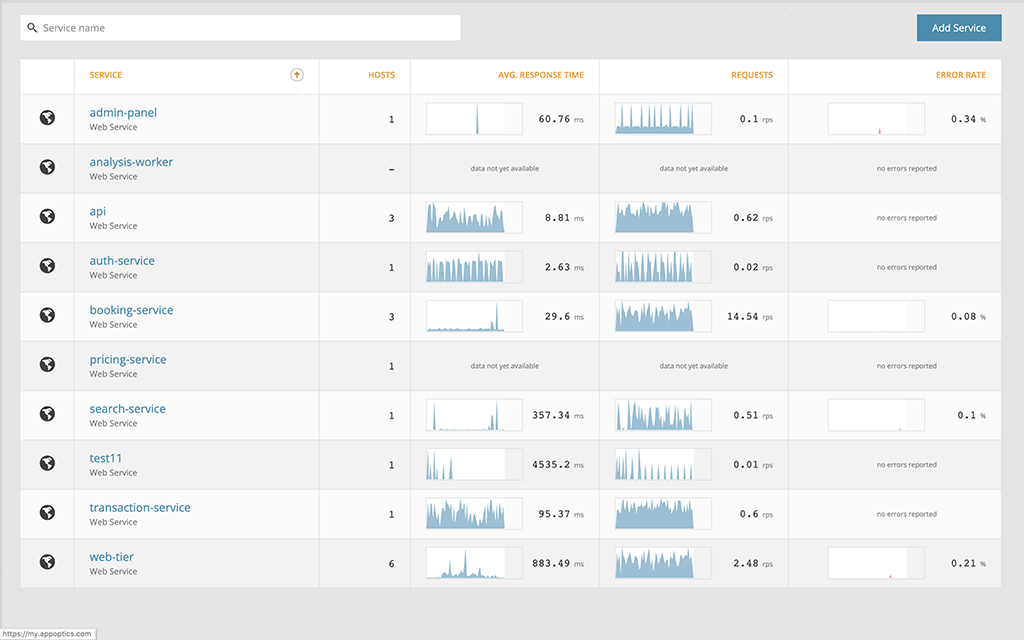
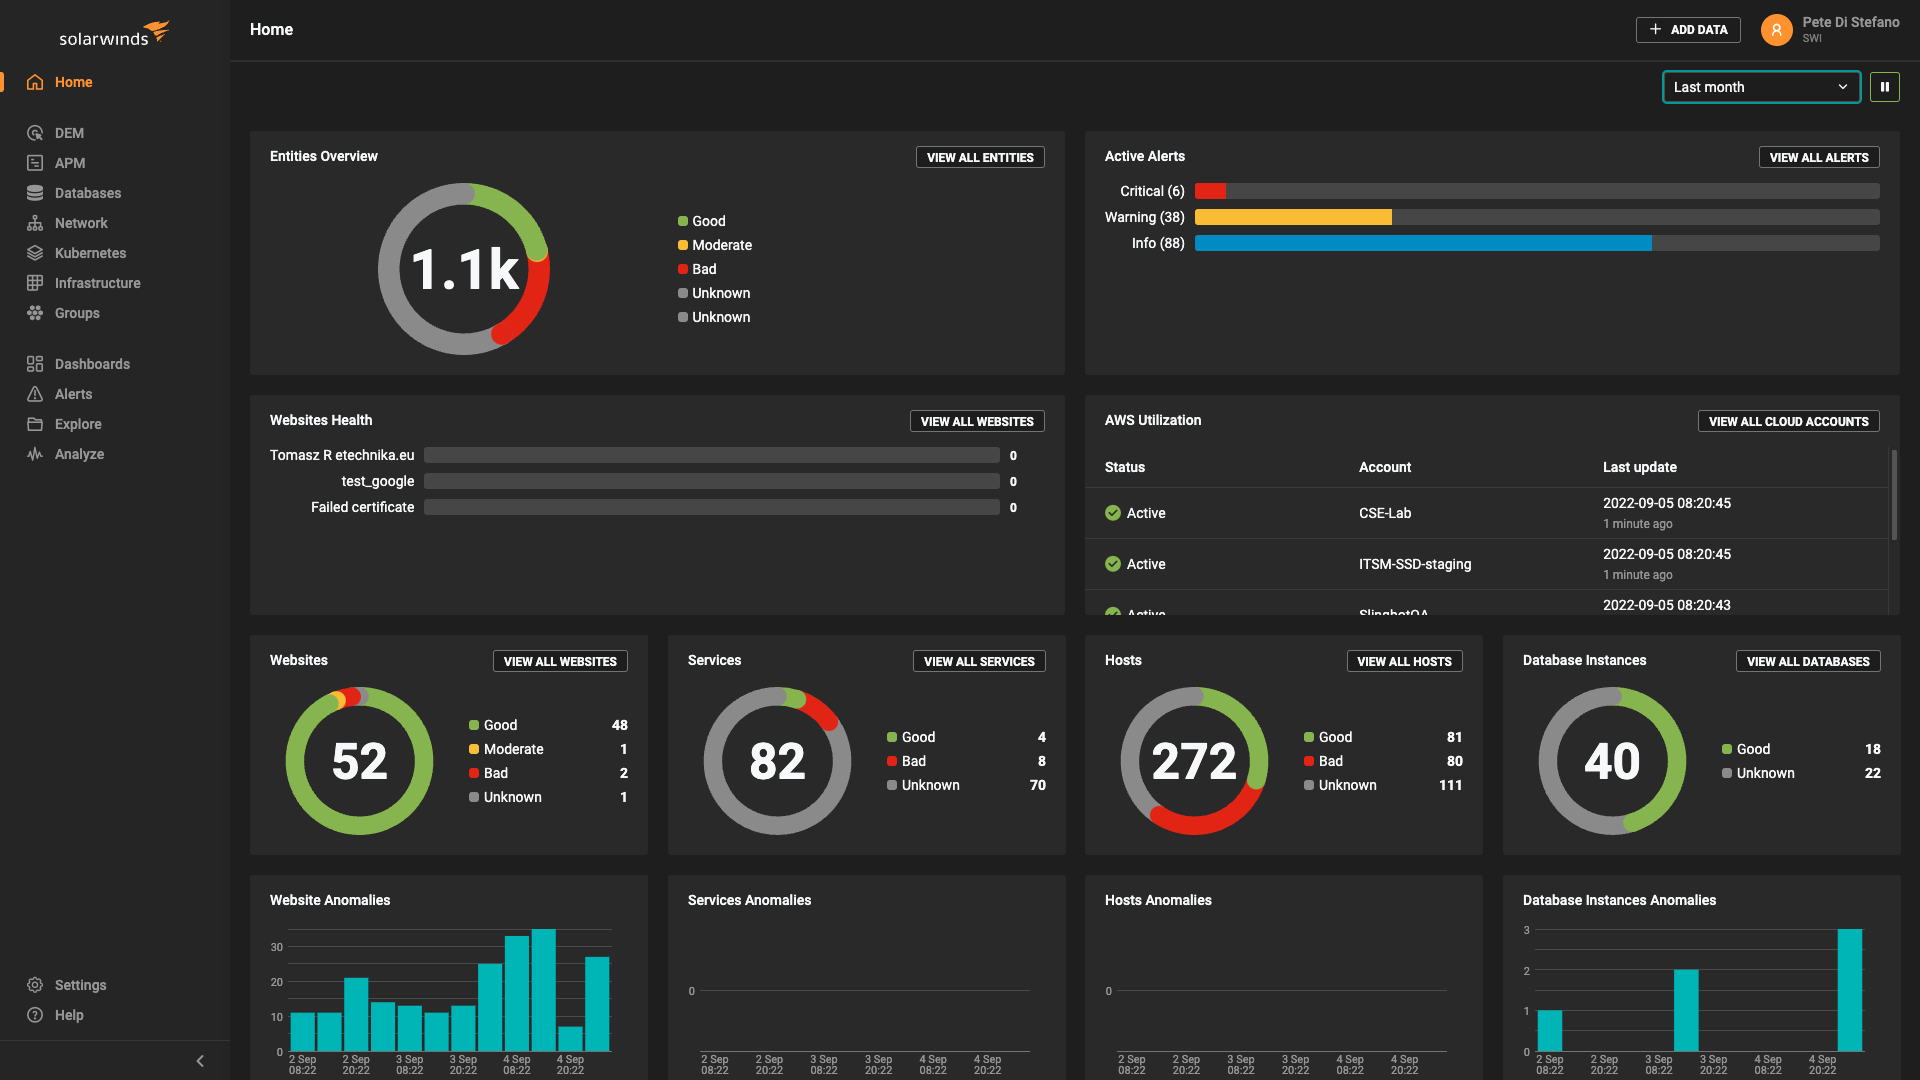
Make it easy on yourself—use tooling. Server monitoring tooling, such as SolarWinds® AppOptics™, helps you monitor metrics or create alerts for your Windows server. Furthermore, AppOptics provides you with out-of-the-box, pre-populated dashboards to monitor the health and performance of your server in real time. You just have to provide the tool with the needed data to start tracking related metrics.
Define Metrics to Track
Lastly, define metrics to track the health and performance of your Windows server. By continuously measuring certain performance metrics, such as CPU usage or memory utilization, it’s easier to detect changes but also easier to pinpoint problems and start troubleshooting them.
Key Metrics to Track for Windows Server Monitoring
Here’s an overview of seven key metrics for your Windows server.
- CPU Usage
Measuring CPU usage allows you to detect performance bottlenecks. Furthermore, you can use CPU usage to automatically scale your application whenever the CPU usage spikes. However, make sure to check you don’t have a performance bottleneck. Otherwise, scaling your server to solve this performance bottleneck can become costly.
- System Interrupts
Measuring system interrupts allows you to detect hardware issues. As this article explains, “An interrupt alerts the processor to a high-priority condition requiring the interruption of the current code the processor is executing. The processor responds by suspending its current activities, saving its state, and executing a function called an interrupt handler to deal with the event.”
Normally, system interrupts occupy a small percentage of your CPU usage, between 0.1% and 3%. However, when you notice system interrupts consuming above 5% of your CPU usage, consider investigating your hardware for problems or reboot the server.
- Memory Usage
Monitoring memory usage allows you to detect memory leaks. A memory leak occurs when your Windows server incorrectly manages memory allocations, so memory that’s no longer needed isn’t released.
- Disk Usage
The disk usage is an important metric as it tells you a lot about the performance of your server. Here’s an overview of possible metrics you can track:
- Free disk space percentage
- Number of disk reads per second
- Number of disk writes per second
- Disk transfers per second: the rate of read and write operations
Most importantly, you should focus on the number of disk writes per second. This metric can detect the rapid creation of files, often associated with a hack or computer virus.
- Login Count and Failed Login Count
As mentioned before, the number of failed login attempts can reveal a malicious person is trying to gain access to your server. You can also track the number of successful login attempts.
- Network Monitoring
Network monitoring concerns itself with metrics such as:
- Packet outbound errors: number of failed packet transmissions
- Packet received errors: number of received packets that contained errors
- Bandwidth: tracks the maximum rate of data transfer for your server
For example, an incorrect firewall configuration might cause packets to fail delivery. The packet outbound errors metric helps you to detect this problem.
- Resource Monitoring
Resource monitoring is closely related to tracking disk reads and writes. Here, we want to track how often files are being updated or modified. Again, this might indicate an attacker gained access to your server or some malicious process is changing files.
Conclusion
Monitoring matters. Most importantly, monitoring helps you shift from reactive to proactive monitoring. In other words, detect or even prevent problems before they occur.
Not many system engineers think about monitoring their Windows server. However, Windows server monitoring brings a lot of benefits. You can detect memory leaks, attackers trying to gain access to your server, or rapid updates for server resources by unwanted processes. Without server monitoring capabilities, you miss out on this information. Furthermore, troubleshooting server problems becomes much easier with those enhanced server insights.
Lastly, make sure to check out AppOptics Windows server monitoring. Nowadays, you need an automated tool to help you quickly set up monitoring capabilities. Through automated monitoring, you can provide a higher-quality service to your users and provide them with higher availability of your server.
This post was written by Michiel Mulders. Michiel is a passionate blockchain developer who loves writing technical content. Besides that, he loves learning about marketing, UX psychology, and entrepreneurship. When he’s not writing, he’s probably enjoying
