Planning a hybrid application migration? There’s plenty to deal with already, and now your manager wants to know—how are you going to make sure that the migration is a success?
The secret is to take a subjective judgment and turn it into an objective one. As you probably know, there is no way that you can guarantee a problem-free migration. Don’t leave it up solely to how your boss or anyone else feels about the migration. However, what you can do is to proactively define success with objective measurements. Provide concrete, measurable metrics which will be used to determine whether the migration was a success.
How do you get these metrics, you ask? There’s no point in reinventing the wheel. The SolarWinds APM Integrated Experience offers a robust set of application performance monitoring (APM) tools that can give you the information you need at each step of the migration to both make the right decisions and demonstrate the success of the migration to your boss. In this article, I’ll cover the challenges of a hybrid application migration, what APM is, and how to use APM on your hybrid application migration. At the end, you’ll come away with a plan for how APM can make your hybrid application migration a success.
The challenges of a hybrid application migration
In any hybrid application migration, there are a few common challenges. These challenges occur regardless of the size or scope of your migration.
Less control over infrastructure
First, in the case where on-premise infrastructure is being replaced by the cloud, you lose some control over the infrastructure. The amount of control lost varies depending on the cloud replacement. (For example, are you using IaaS or PaaS?) For some people, however, on-premise hardware is reassuring, as you can always walk into the server room and work directly with the hardware; the loss of this can be disconcerting.
Increased fragmentation of data and services
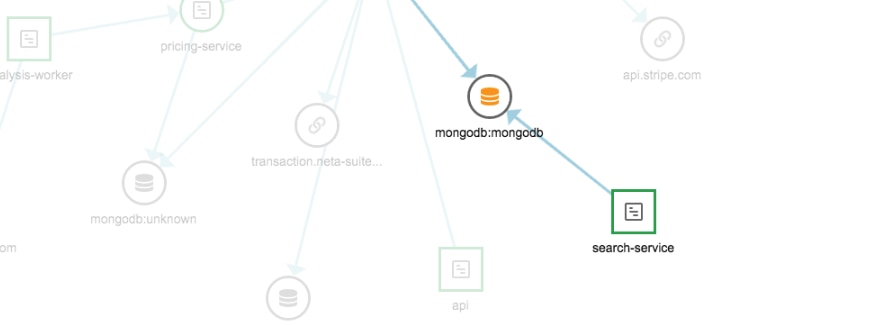
Second, by moving towards a hybrid environment that’s both cloud and on-premise, there is increased fragmentation of your data and services. Decisions must be made about which servers or applications are moving to the cloud and which ones are staying on-premise, and this leads to increased management complexity. Plus, your infrastructure team now has to learn (at least) two different methods of accessing servers.
Continued need for consistency, integration, and control
Finally, despite these complexities, you still need your application’s consistency, integration, and control to meet or exceed current levels. In basically every case, the main concern of those overseeing a hybrid application migration is that their applications and services continue to be consistently available while providing the needed flexibility to application developers and users. Since the environment is more complex, the task of delivering this availability has become more difficult.
These challenges are inherent to any hybrid application migration, and there is no easy way around them. However, what we can do is demonstrate measurable success at each phase of the migration through the use of APM.
What is APM, and why should I use it?
APM refers to any tool or set of tools which allows you to track the health and operation of your applications. In its most basic form, you can perform APM by periodically loading your website and manually noting how long it takes to load, if any errors occurred, and so on. For a much better approach, though, you would use a tool such as the APM Integrated Experience which provides more advanced features.
Distributed transaction tracing
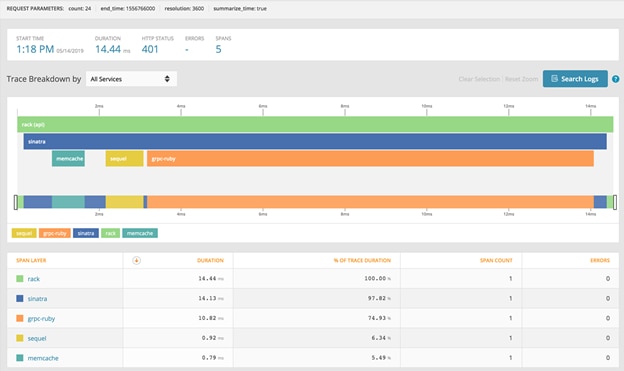
For example, by integrating AppOptics, a part of the APM Integrated Experience, within your application and its various pieces, you gain access to distributed transaction tracing, which allows you to view the path of a single request across any number of services within your entire application. Have a long-running request? You can drill down and find the bottleneck within your application stack. Additionally, these metrics are aggregated, allowing you to see the frequency of any given transaction and even how frequently services are used within that transaction.
Performance/uptime monitoring
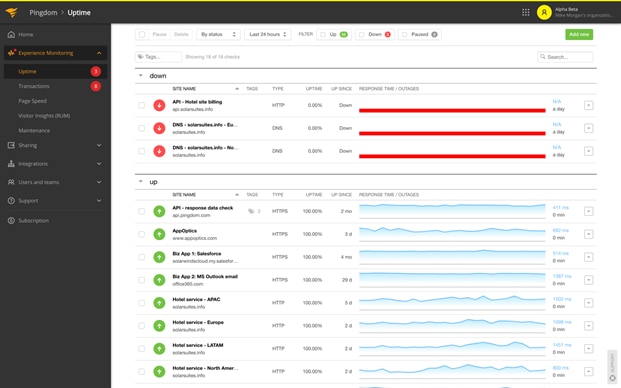
The APM Integrated Experience also brings in performance and uptime monitoring with Solarwinds Pingdom. You can automate the process of testing your application’s, website’s, and server’s availability across the world and get alerted the second they become unavailable. With a good baseline of historical data, this makes it simple to determine whether an application’s availability or performance has increased, decreased, or remained the same.
Log centralization and analysis

The APM Integrated also features Loggly, allowing you to centralize logs for analysisAll too often, status and log messages output by applications are ignored until after a problem has surfaced, and that’s already too late. By centralizing logs, you can monitor proactively by setting up event notifications for abnormal events or trends. Plus, when problems do occur, troubleshooting is easier and faster, especially if you enable trace context in logs.
Through these and other features, APM tools such as the SolarWinds APM Integrated Experience allow you to monitor your application’s performance. With them, you can demonstrate continued and sustained performance across each phase of your hybrid application migration.
APM for hybrid application migrations with the APM Integrated Experience
The details of each hybrid application migration will vary, and thus the details of implementation will vary as well. Depending upon the size and scope of your applications and your migration, different levels of monitoring will be required, and so there is no one-size-fits-all blueprint to follow. That said, there are some basic principles which will allow you to utilize APM most effectively.
Set a baseline
First, you need to set a baseline before you begin your migration. Add AppOptics into your application and onto your servers, send your log info to Loggly, and let the system collect enough data so that you have a good baseline. If your application usage is fairly constant, a month of data might be enough time. If usage is seasonal, you may need anywhere from six months to a year of data.
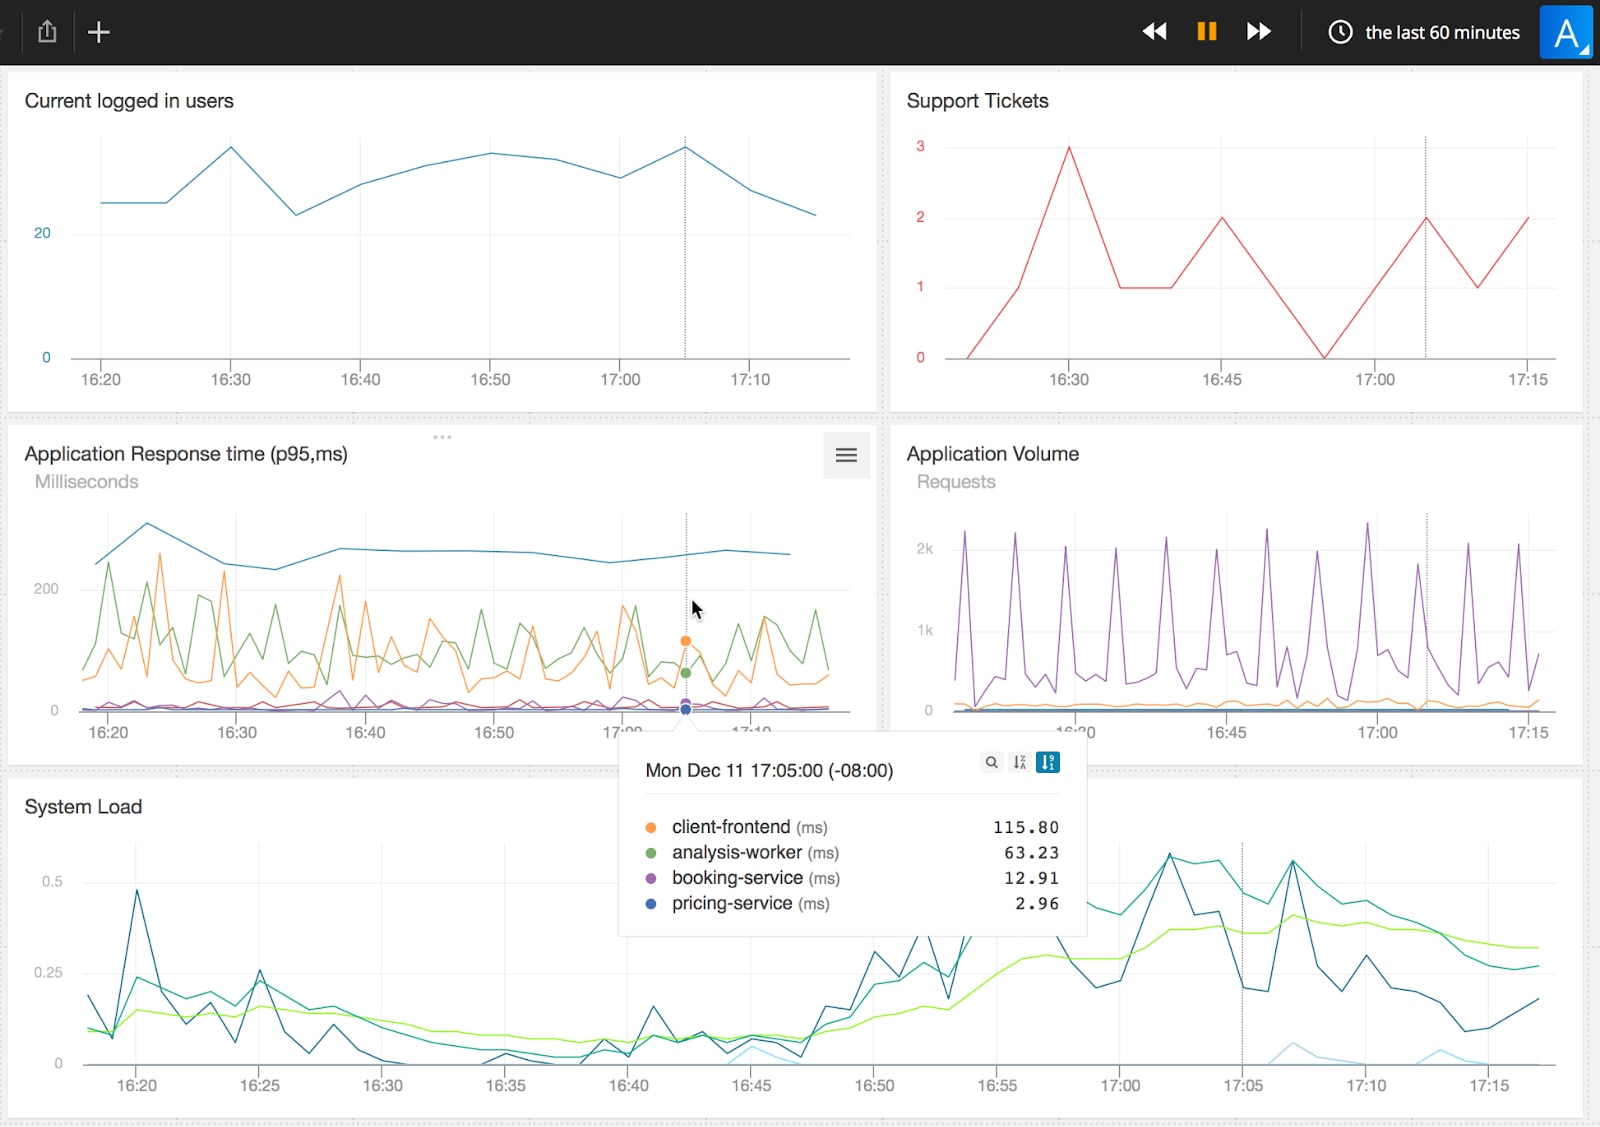
While collecting data, you can set up your dashboard and determine which metrics are the most relevant for your application. Some standard ones include currently logged in users, application response time, and overall system load.

A sample dashboard
Similarly, you can set up alerts to notify you of any abnormal events. Get a sense for how often abnormal events occur. During this time, you may find some opportunities to improve your application and resolve some previously unrevealed technical debt. Take advantage of those! The more stable your application is before your migration, the higher your chance of success.
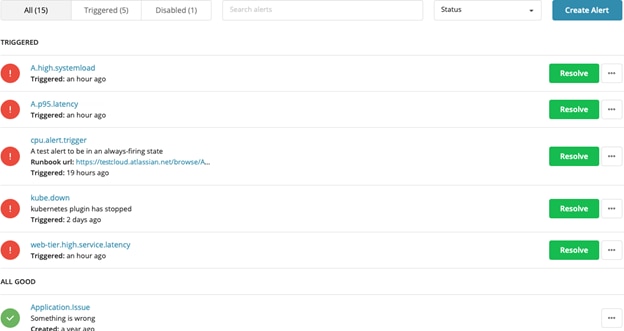
Once you have enough data, you should take note of each of your key metrics. Take note of what “normal” is, and use that baseline as your measure of success for the migration. Make sure to send that baseline information to your team and your manager so that everyone is on the same page. You’re ready to begin the migration!
Monitor performance across each phase of the migration
As you complete each phase of the migration, make sure to add in any new services and hosts into your integrated AppOptics environment. This will allow you to verify that performance and availability baselines have been maintained at each phase of the migration. This provides confidence to your team and the rest of the organization that the migration is going smoothly.
Additionally, you can leverage the APM Integrated Experience to run traces, perform code profiling or analyze the logs if any performance issues arise after each phase of the migration. Proactive monitoring will allow you to get a handle on issues before they become more severe.
Verify performance at the end of the migration
Finally, once your migration is complete, compare current performance against your established pre-migration baseline. Additionally, note any areas for future improvement. By establishing in an objective fashion continued or improved performance, you will have grounds for declaring your migration a success!
Conclusion
In this article, we’ve considered the challenges of a hybrid application migration and how APM tools such as the APM Integrated Experience can help to make your migration a success. The key is to get started early enough so that you have a solid baseline and everything installed before your migration begins. Additionally, it can take some time to get your team and organization onboard with the idea of measuring success through metrics. Once all that is in place, you are well-prepared for a successful migration. Good luck!
To learn more about monitoring the health and performance of your IT environment before, during, and after migration check out the 30 day free trial of the APM Integrated Experience. This powerful and remarkably affordable solution combines infrastructure, application, log and user experience monitoring in a single pane of glass to simplify end-to-end performance monitoring and accelerate troubleshooting.


