Delivering a high-quality app or service to your customers depends on highly available infrastructure behind the scenes. When your service is unavailable, slow, or broken, customers can get frustrated, and reduce spend or stop using your service altogether. Your operations team needs quick visibility into problems to help prevent service quality from degrading and impacting your business.
Modern distributed systems that run popular apps give off hundreds of metrics in the form of infrastructure and host metrics like CPU utilization, APM metrics like response times, database metrics, and more. It’s not practical to monitor all of these constantly, so we recommend picking a subset that serves as your application’s key performance indicators when monitoring distributed systems.
Google’s site reliability engineers (SREs) defined four key metrics to monitor. They call them the “four golden signals”: latency, traffic, errors, and saturation. These are closely related to the RED metrics for microservices: rate, errors, and duration, and the older USE method focusing on utilization, saturation, and errors. These four signals should be a critical part of your service level objectives (SLOs), since they are essential for delivering your service with high availability. We’ll describe the four golden signals in more detail and then show you how to monitor them in your distributed systems using industry-leading tools.

Latency
Latency is the time it takes to send a request and receive a response. Latency is commonly measured from the server side but can also be measured from the client side to account for differences in network speed. Your operations team has the most control over server-side latency, but client-side latency will be more relevant to your customers. It’s also important to know when stressors on your application’s environment are or aren’t affecting your end users.
The target threshold you choose can vary based on the type of application. An automated system like an API or ad server may require much faster response times than a human on a mobile phone. You should also track the latency of successful and failed requests separately since failed requests often fail fast without extra processing.
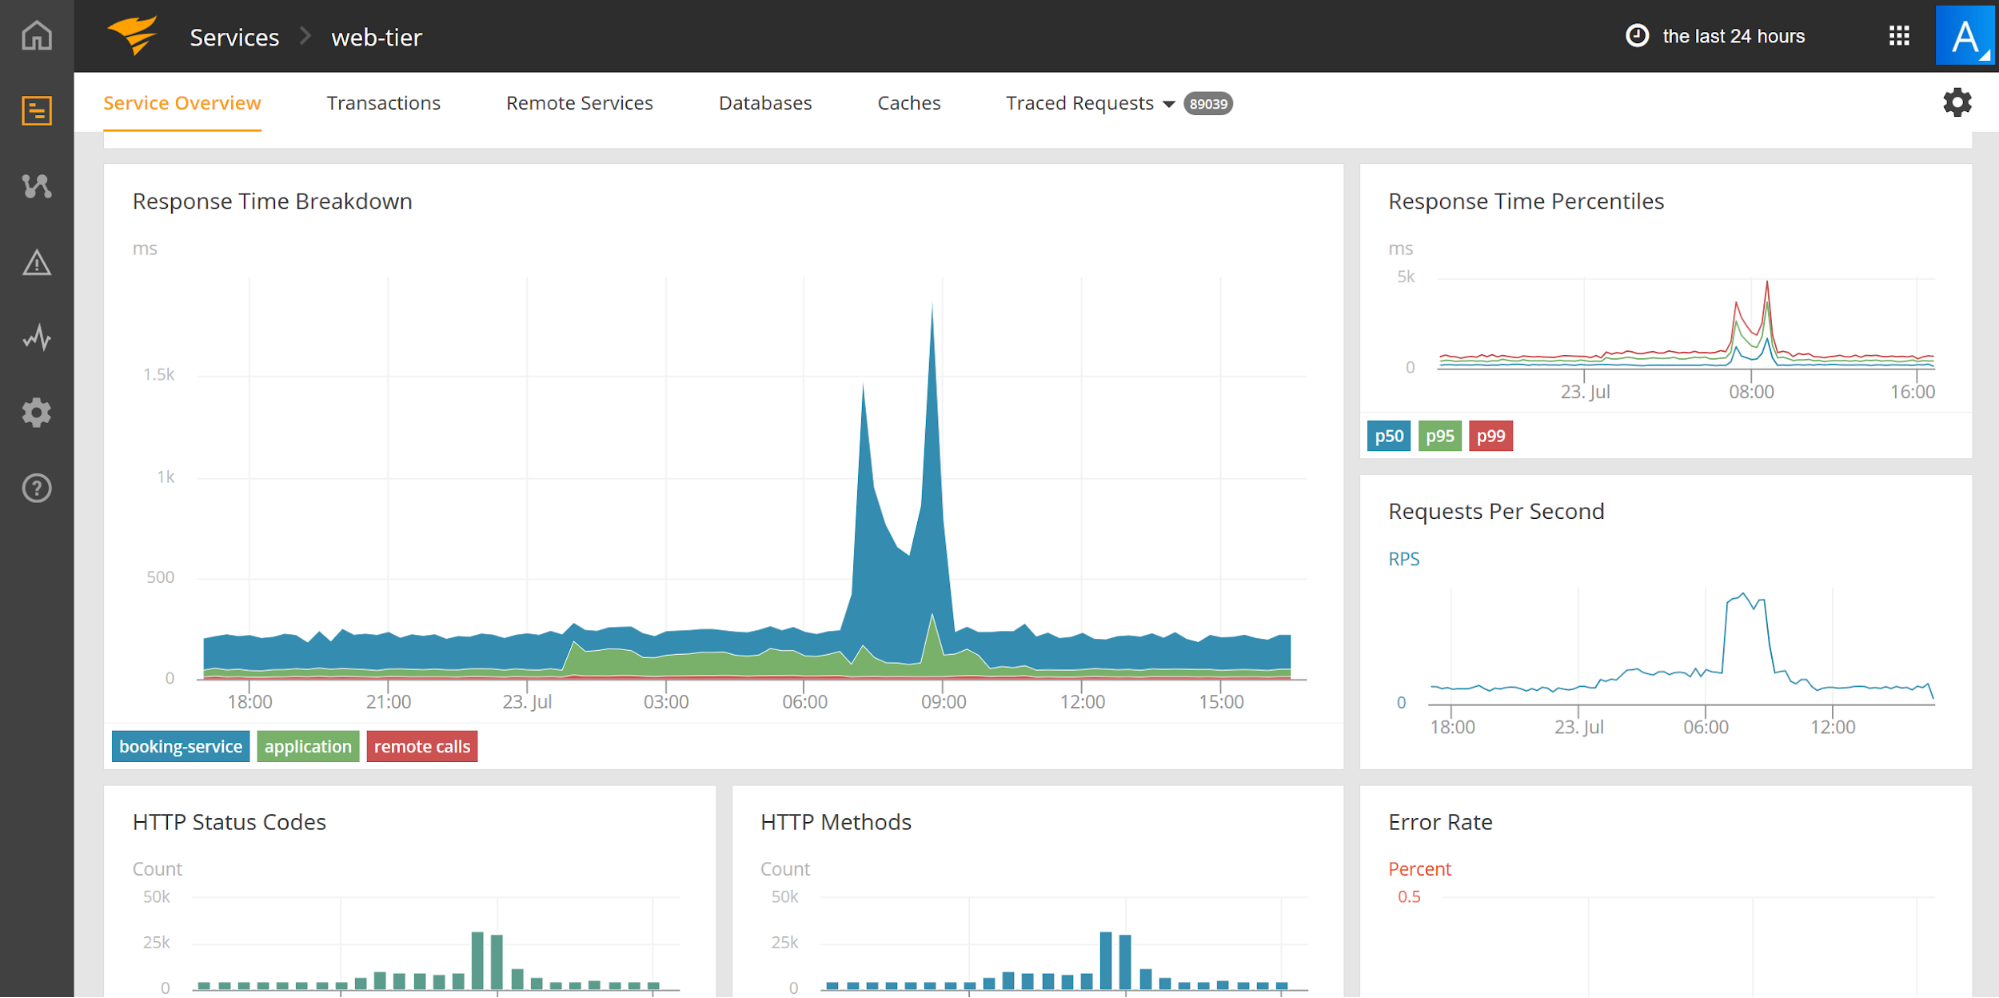
For server-side latency, SolarWinds® AppOptics™ can be a good way to monitor response time. You can easily see spikes in response time on the dashboard or in alerts. To help troubleshoot issues, it is designed to provide the breakdown by backend service in your distributed systems monitoring and can even trace individual requests through your stack.
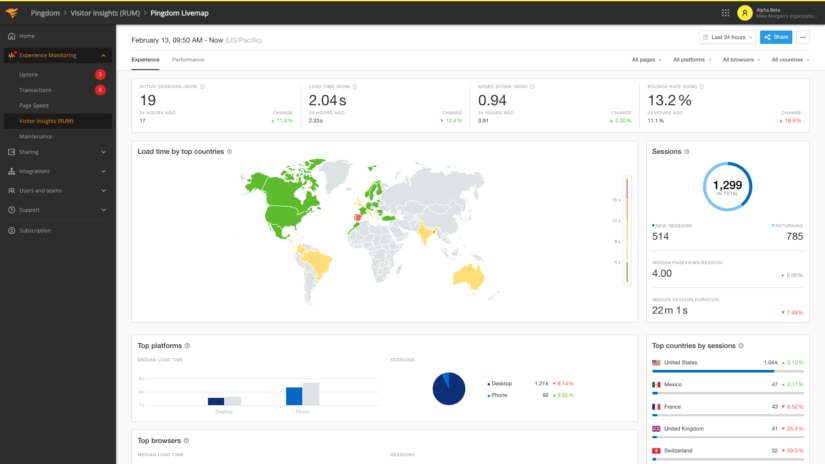
To measure client-side latency, you’ll want to use a tool that can perform real user monitoring (RUM) such as SolarWinds® Pingdom®. It can provide the breakdown of user performance across different geographies, platforms, and more.
Traffic
Traffic is a measure of the number of requests flowing across the network. These may be HTTP requests to your web server or API, or messages sent to a processing queue. Times of peak traffic can result in additional stress on your infrastructure and may push it to the limit, triggering downstream effects. It’s a key signal because it helps you differentiate capacity problems from improper system configurations that can cause problems even during low traffic. For distributed systems, it can also help you plan capacity ahead to meet upcoming demand.

Errors
Errors can tell you about misconfigurations in your infrastructure, bugs in your application code, or broken dependencies. For example, a spike in error rate could indicate the failure of a database or network outage. Following a code deployment, it could indicate bugs in the code that somehow survived testing or only surfaced in your production environment. The error message will give you more information on the exact problem. Errors can also affect the other metrics by artificially lowering latency or repeated retries that end up saturating other distributed systems.

Saturation
Saturation defines the load on your network and server resources. Every resource has a limit after which performance will degrade or become unavailable. This applies to resources like CPU utilization, memory usage, disk capacity, and operations per second. It takes understanding of your distributed system design and experience to know which parts of your service could become saturated first. Often, these metrics are leading indicators, so you can adjust capacity before performance degrades.
Reaching the saturation limit can affect your service in different ways. For example, when the CPU is full it can result in delayed responses, full storage space can result in failure on disk writes, and network saturation can result in dropped packets. The AppOptics dashboards and monitoring alerts can help you keep an eye on these resources and help you proactively adjust capacity before they become saturated.

These four golden signals are key to helping deliver a good customer experience. The tools available in the APM Integrated Experience, like SolarWinds AppOptics™ and SolarWinds Pingdom, can help you track each of these signals easily within your distributed systems monitoring. You can use them to report on your service level objectives and quickly troubleshoot problems by drilling down to get extra detail. They’ll also alert you, so you can proactively fix problems before they affect your customers. Sign up for a free trial of the integrated experience to unlock the full details of the health and performance of your application and supporting environment. Your customers and your business team will thank you!