
Observing distributed systems is a complicated problem. Traditional metrics and logging systems provide insights into the current state of our services, but it’s often not enough data to fully debug complex systems. Since modern applications operate in highly concurrent, available environments, it is difficult to get insights into individual requests or events that occur.
Tracing is an incredibly powerful tool for understanding the inner-workings of our services over the lifespan of a request. Unlike standard metrics and logging, which should be a framework for automated alerting, tracing is best used by operations and development teams as a tool for hands-on debugging. Once we have implemented tracing in our application, we need a way to visualize and investigate these traces. In this article, we will look at some of the features of two open-source tracing frameworks: OpenZipkin and Jaeger.
What is OpenTracing?
In another article, we dove into OpenTracing and OpenCensus to look more into the mechanics of how tracing works. As a short summary, tracing depends on passing request-scoped information between segments of our application. These segments are called spans, with the top-level span representing a complete request. Spans can be broken into sub-spans that constitute individual components of a request tied together across multiple services.
Although tracing solutions often offer traces out of the box with supported languages, teams frequently need to customize the spans to add more detail. Since tracing often integrates deeply with codebases, switching out significant amounts of code to change providers is a barrier to adoption. OpenTracing formalizes tracing as an interface for tracing providers to integrate. This allows application developers to integrate the OpenTracing APIs with their application and use the upstream provider of their choice for ingesting and displaying traces.
Although we will be using different backends for our tracing, our demo application will use OpenTracing at its core. These examples will be using the Go Programming Language and the OpenTracing Go API, but you do not need to understand it in order to follow along with the examples.
Intro to Zipkin
First, we will look at Zipkin. Zipkin is based on the Google Dapper paper, representing a reference architecture for a distributed tracing system. It was built for internal use at Twitter and has since been open sourced for use elsewhere.
The Zipkin architecture is made up of four components: the collector, storage service, search service, and a web UI. The collector is an ingest daemon that validates incoming data and passes it along to storage. The search service and web UI work together to provide a UI and API for users to query Zipkin and retrieve traces from the database. Zipkin’s most important component is its storage engine, and users can select between Cassandra, ElasticSearch, and MySQL®. The storage engine you use is dependent on your operational expertise and scaling requirements. But for development and light production use, using MySQL is the simplest choice as it is easy to stand up and can run as a standalone service
The Zipkin search UI looks like this:
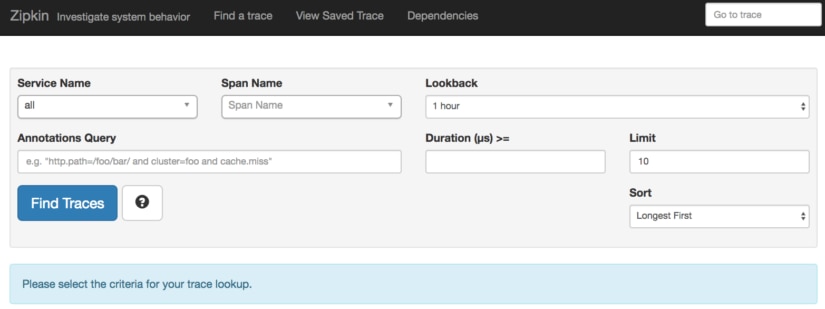
We have an example application that is composed of a CLI, two services, and a simulated database query. Pulling up this trace breaks down the components of our request:
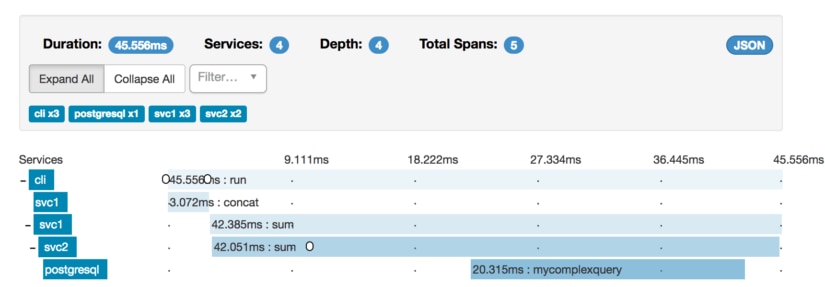
Here we see a complete breakdown of events from the start of our CLI call to the individual service invocations. The CLI calls out to svc1, which sums several numbers and then concatenates them together. To complete this sum step, it must call out to svc2, which continues working on the request. Svc2 then calls out to postgres to make a query before returning.
Along the way, we can annotate our request with events, represented by the small white circular bubbles. These can be used to add in tags at individual points in time.
With a CLI tool, two services, and a database, tracing this request with logs or metrics would have been difficult. Thanks to the context propagation features tracing provides, we get a holistic view of this entire service. Metrics and logging are still useful, but we can better scope our log searches to the subset of services we are investigating instead of trying to forensically reassemble application flows from log data.
Clicking on any individual span gives us a lot more data about this span:
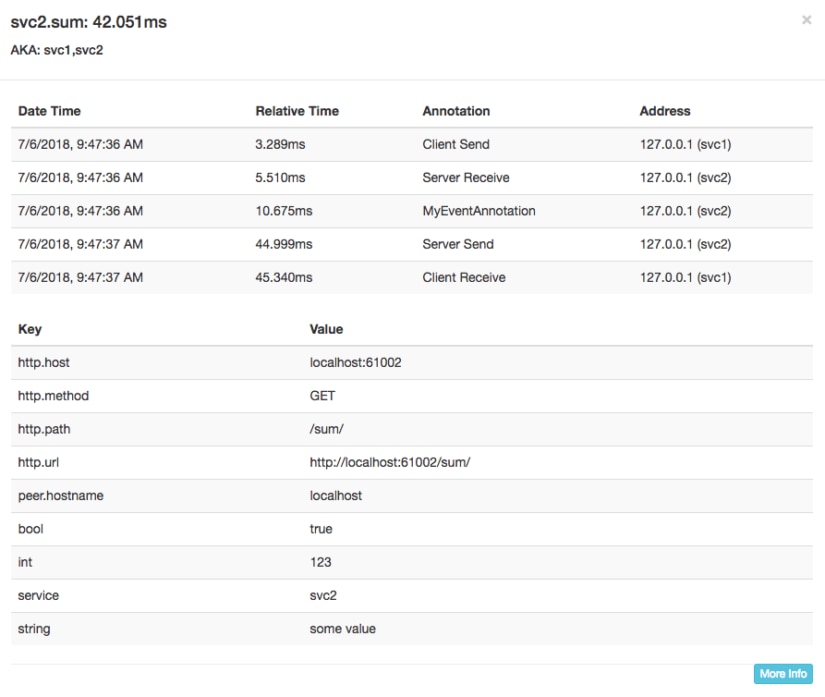
Here we see the complete lifecycle of the svc2 span, complete with some key-value data that got propagated along with our request. This can be used to annotate more information to help with debugging this request.
Now that we’ve seen Zipkin, it’s time to look at this same application in Jaeger.
Intro to Jaeger
Jaeger is a Go-based tracing tool originally developed in-house at Uber. It has since become a Cloud Native Computing Foundation project and is under active development. Jaeger is composed of very similar components to Zipkin, and has a collector, datastore, query API, and UI. It even supports the Zipkin ingest port and interface, allowing Zipkin services to be used seamlessly with Jaeger.
The difference between Jaeger and Zipkin ultimately comes down to your preference for architecture and how the information is displayed. They both offer similar features and functionality. The Jaeger UI storage is also swappable and can be used with Cassandra and ElasticSearch. The primary architectural difference between Jaeger and Zipkin is that Zipkin is implemented in Java, and Jaeger uses Go. Jaeger also supports tools such as Prometheus for monitoring, which helps with integration for businesses that already heavily rely on cloud-native tooling.
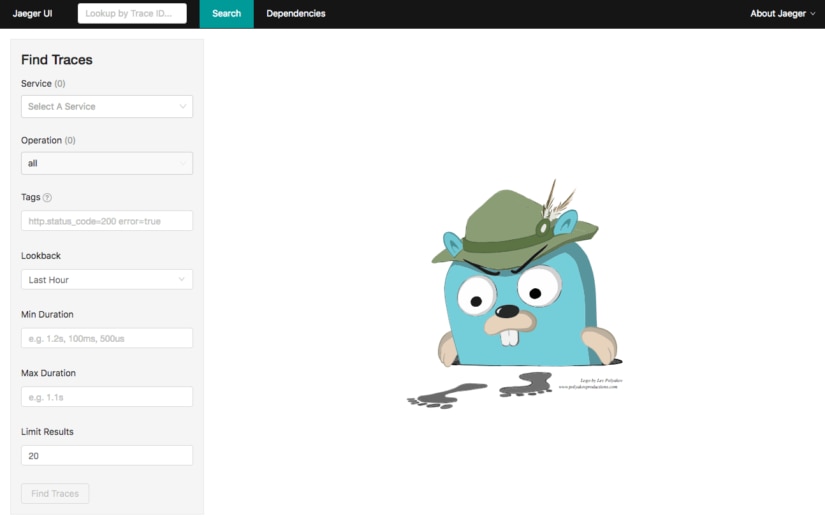
The Jaeger UI is search-focused, much like Zipkin:
Once again, we can run our CLI tooling to get a trace and ingest it into Zipkin. Because we are using OpenTracing, the code changes to switch from Zipkin to Jaeger are minimal, and only require us to change the backend instead of completely changing our codebase again. Here’s what the same trace looks like in Jaeger:
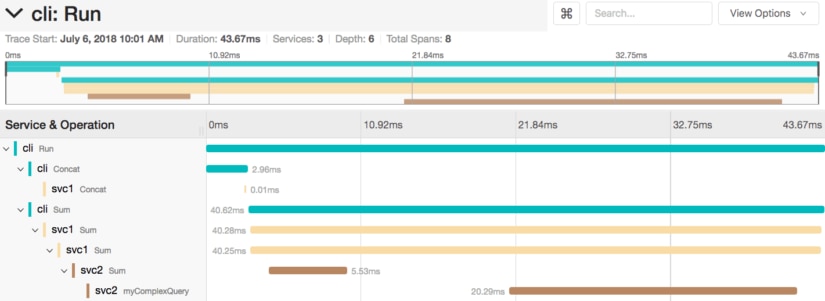
Jaeger gives us a similar breakdown of our services across the entire request. As before, we start with the CLI, but we have an extra level of granularity in our top-level UI. Jaeger has given us a more granular breakdown of our concat and sum steps, with each step being individually timed at the CLI level. This is visible in Zipkin as event annotations but is much clearer in Jaeger.
The information about the svc2 span is also treated differently:
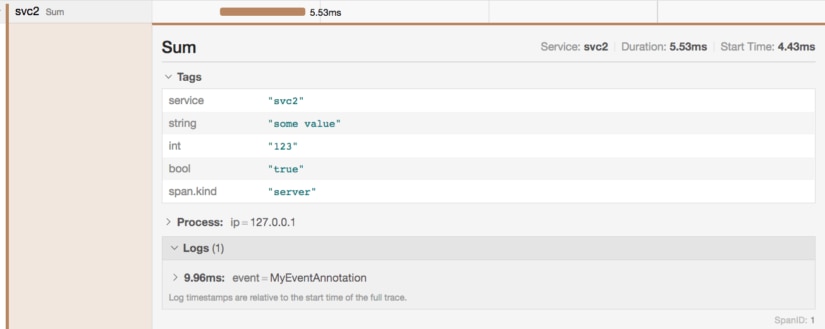
Much like before, we have the tag information available to us for the span. However, instead of displaying events in-line in the timeline like Zipkin does, Jaeger breaks them out into logs for that span.
Zipkin and Jaeger have a self-hosted infrastructure that is run as part of your environment, and requires operations time to deploy, run, and maintain. Second, Further, these tools do not have any auditing or access control at this time, which may make them unsuitable for certain environments. If you are looking for these features, you may want to look for a more fully-featured service that can support OpenTracing.
Fully-Managed Tracing with SolarWinds AppOptics
SolarWinds® AppOptics™ is an Application Performance Monitoring (APM) tool that provides the features we’ve just documented above with visibility into the performance of your entire infrastructure. AppOptics gives you an insightful representation of the trace and combines APM, infrastructure and customer metrics into a single pane of glass.
The AppOptics APM libraries support OpenTracing and changing from using Zipkin or Jaeger to AppOptics is, like before, a matter of simply changing the backend out to use the AppOptics agent.
Below, you can see we have registered our CLI and backend services as services within AppOptics:
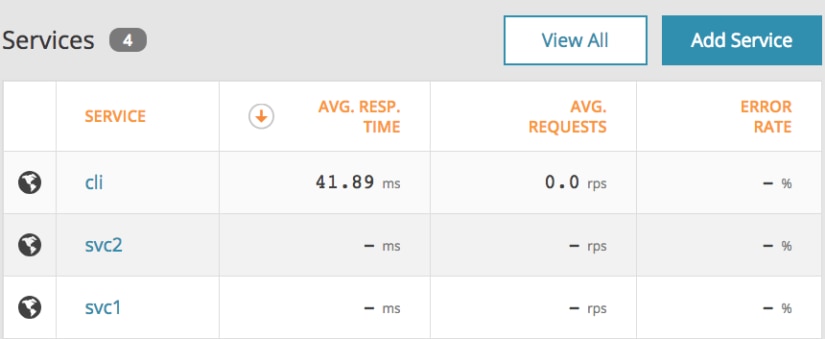
Once again, we will run our CLI tool to get a trace. After a few seconds, our trace shows up:

In AppOptics, our trace looks slightly different. This is because AppOptics will correlate each service but give you a single service’s perspective at a time. We can view individualized breakdowns for each of our services and get separate performance monitoring for each one.
Much like before, we can get the individual event annotations for our svc2 keys:

As I mentioned above, you won’t need to switch between multiple different tools when troubleshooting problems as they are all integrated together. Check out more AppOptics features.
Next Steps
The power of tracing is undeniable. It’s time to add tracing to your application and get deeper insights into its performance. Sign up for SolarWinds AppOptics, integrate the OpenTracing and AppOptics APM libraries for your favorite programming language, and start collecting some traces!