While standard logging and metrics collection approaches give us an understanding of our application from a single vantage point, it is less useful for understanding the flow of execution and data through our applications, especially across network boundaries. Logging tools can be used for this purpose, but correlating log events for a single request is a manual, labor-intensive process. Metrics are useful in aggregate and provide a great framework for understanding the state of our application, but by themselves do not answer why services are failing.
Tracing completes our view of application health. By passing request-scoped information through our application and adding spans to break up this information into time-scoped blocks, we get an external view of every step our application takes to serve a request. In this way, distributed tracing provides essential context missing from other monitoring approaches.
There are several standards for distributed tracing, including OpenTracing and Open Census. We’ll describe these two open source standards and show how to use OpenTracing with SolarWinds® AppOptics™.
OpenTracing 101
OpenTracing provides an open API for integrating tracing into a codebase, and for allowing third-party “tracers” to collect tracing data from code. Software that is instrumented using the OpenTracing API can be traced by any tracing vendor or project that provides a “tracer” implementation for the OpenTracing API in that language. The main goal of OpenTracing is to specify a common set of tracing concerns into an API that enables users to switch tracing vendors without rewriting their instrumentation; the downside is the API is currently fairly low-level and intended more for library authors than application developers.
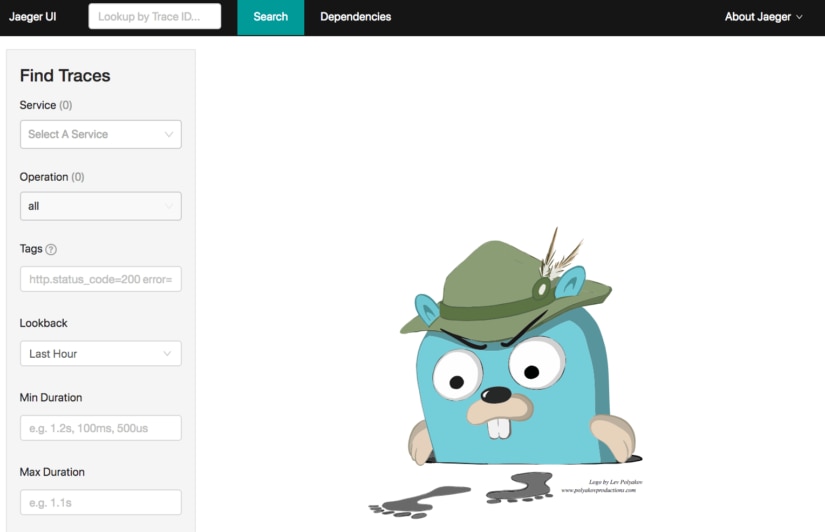
To see OpenTracing in action, let’s look at an example. We will be using the Jaeger tracing suite. This is a Cloud Native Computing Foundation (CNCF) sponsored OpenTracing implementation originally made for in-house use at Uber. After starting up the Jaeger omnibus container, we can navigate to the UI:

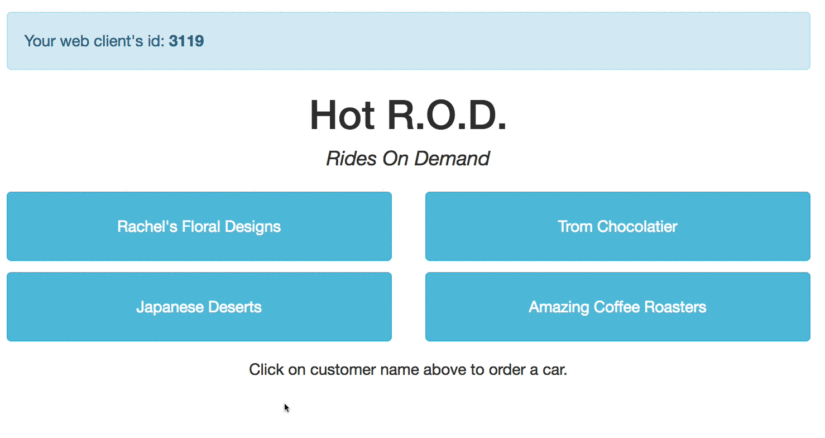
Now we can begin collecting traces. One of the provided Jaeger examples is Hot R.O.D., an example service that demonstrates a ride-sharing application across four backend services. After starting up our service stack, we can go to the UI and call for a ride:

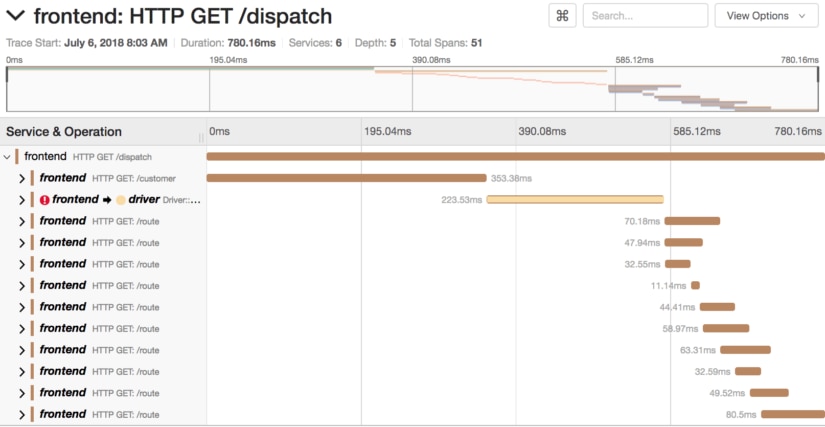
Our application crossed several service boundaries to do this. We could try to piece together logging with an architectural diagram to understand the flow of data through our application, or we can open the trace. In Jaeger, when we open the trace, we get a time-based breakdown of our request.

Here we see a millisecond resolution breakdown of our entire request and the steps it took before responding. Immediately, we see that two-thirds of our request is spent in two sections. We can drill down further into these two sections to better understand how this service is performing.

This section reveals a possible place for optimization. We see that we call out to a customer service, and then further call out to MySQL to select a row. Outside of network traffic, this is where the entirety of time is spent in this span. We now have a great place to start optimizing our customer service MySQL calls, and don’t need to worry about our frontend service.

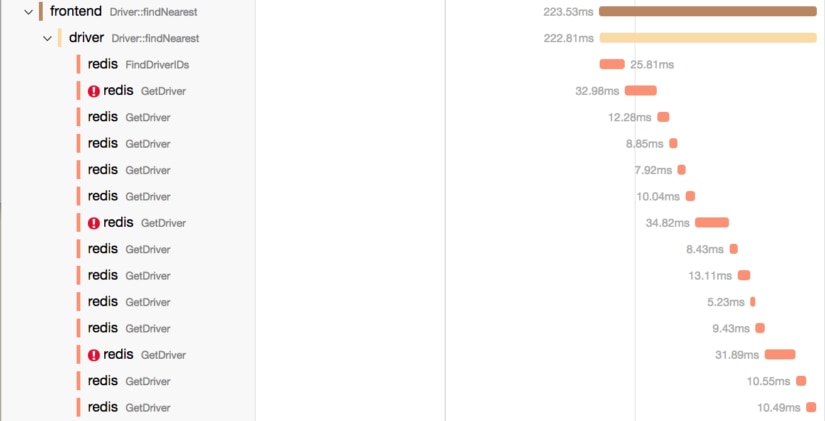
Here is the second time-consuming span, which, based on the tag, is finding the nearest driver. We can again see the frontend calls out to another service, this time the driver service. Inside the driver service, our time is spent making 14 Redis calls, with three of them resulting in errors that we can further investigate with tagging and logs. Depending on our application, this reveals possible optimizations that can be made to improve the performance of our service.
How does all of this work? Tracing works by using the concept of spans. A span is a single unit of time and activity in tracing, and can be broken down into multiple sub-spans, as we can see in the graphs above. The frontend span is broken down into a bunch of Redis sub-spans, all collapsing upwards into a single request-response trace.
As we cross service boundaries, tracing needs to keep track of the request and coordinate it across all of the different services. HTTP is stateless, so we propagate a header through our application. Jaeger uses this to re-construct the view of our request after it receives all of the information. OpenTracing libraries provide this concept of context propagation, so it’s as easy as creating a span from a context:
if span := opentracing.SpanFromContext(ctx); span != nil {
	span := d.tracer.StartSpan("SQL SELECT", opentracing.ChildOf(span.Context())) tags.SpanKindRPCClient.Set(span)
	tags.PeerService.Set(span, "mysql")
	span.SetTag("sql.query", "SELECT * FROM customer WHERE customer_id="+customerID)
	defer span.Finish()
	ctx = opentracing.ContextWithSpan(ctx, span)
}
This code reconstructs a span from our context. In this case, this is the customer service, with a span originating from the frontend service. Because it is an example, it simulates the call to MySQL, but this would look the same when operating against a real database.
Although OpenTracing solves our distributed tracing needs across multiple languages and services, there are some shortcomings that must be conquered. First, ensuring you have the correct spans is critical to prevent problems from hiding in un-traced spans. Tracing can also be expensive, and sampling too many traces can impact the performance of your application. For that reason, you should use metrics to help profile the impact of tracing on your request rate and duration and adjust the depth of your tracing accordingly.
Adopting an open-source tracing system like Jaeger also leaves much to be implemented by the end user or implementer. You must choose your own transport layer and backends and must maintain a great deal of your own infrastructure to be successful. Furthermore, while OpenTracing covers our tracing needs, the project does not include a metrics API within its scope. A new OSS framework has recently been proposed that unifies these concerns, called OpenCensus.
OpenCensus 101
OpenCensus is a unified framework for telemetry collection that is still in early development. It includes APIs for tracing and collecting application metrics. It also provides several backends out of the box and a clear API for adding more. Much like OpenTracing, OpenCensus supports a variety of backends such as Jaeger, but also has support for proprietary tracing backends such as AWS X-Ray.
OpenCensus also provides metrics collection backends, providing additional support for monitoring your application vitals. It will export to Prometheus and proprietary metrics collection services, with more on the way. Most importantly, it uses context propagation for both metrics and tracing, so that annotations for different services are represented in both the metrics and traces.
An interesting feature of OpenCensus is that both the metrics and tracing can use the same distributed context propagation, so that tags and metadata can be added to collected metrics and traces. As this tooling matures, it offers the potential for a much more integrated “single pane of glass” between tracing and metrics.
Although early in development, OpenCensus has large company buy-in with Google and Microsoft contributing to the project. Currently, it is most fully-featured with Java and Go, with other packages on the way. For metrics collection, Prometheus is supported. However, the only turnkey combined metrics and tracing provider today is Google Stackdriver, limiting the options for other infrastructure. Development is occurring rapidly on the project and more options for metrics and tracing will be available as time goes on.
Using AppOptics
While OpenTracing and OpenCensus are great options for understanding the health of our applications, a few things should still be considered. These frameworks are still in their infancy, and most of the tooling around them is still in a pre-production state. Additionally, you are responsible for running the infrastructure for metrics and trace collection, which can add additional operational burden. If your monitoring infrastructure goes down, you have missed metrics during this time period and valuable time being spent fixing that infrastructure. Additionally, these solutions typically do not include access control or auditing, which may make them unsuitable for certain environments.
AppOptics provides a hosted solution (SaaS) for tracing and metrics collection, as well as tracing SDKs for Go, Java, .NET, Node.js, Python, PHP, Ruby, and Scala. The AppOptics SDKs provide automatic instrumentation of common web frameworks, and can instrument and measure queries made to databases, cache servers, as well as automatically measure and propagate context along outgoing RPC calls, without any changes to code. Additionally, OpenTracing for Go already works with AppOptics APM, so applications do not even need to change their APIs over for it to work.
Let’s convert our Hot R.O.D. application over to using AppOptics as the backend. By changing the initialization of our tracing to use the AppOptics APM agent for Go, it will automatically forward our OpenTracing requests to AppOptics.
func Init(serviceName string, metricsFactory metrics.Factory, logger log.Factory, hostPort string) opentracing.Tracer {
	aoTracer := aotracing.NewTracer()
	opentracing.SetGlobalTracer(aoTracer)
	return aoTracer
}
After restarting the service and making a few requests, our traces show up in AppOptics:

Here we can drill down into the exact same request in a hosted environment. This gives us all of the power that OpenTracing has to offer, without the care and feeding of your own tracing infrastructure.
Additionally, if this service made requests to Java, .NET, Node.js, Ruby, Python, PHP, or Scala service also running the AppOptics SDK, the trace would also include spans from those services, as in this example in the AppOptics for Go README.
AppOptics also provides integrated metrics and infrastructure monitoring in a single solution—it automatically collects service metrics such as request latency percentiles, throughput, and error percent, as well as host and infrastructure metrics about your servers, containers, and databases. You don’t need to switch between multiple tools when troubleshooting problems. It’s also affordably priced so you can monitor your entire infrastructure without breaking the bank or picking a limited set of servers to monitor. Check out more of AppOptics APM features and use it with OpenTracing today.


