Introduction
Hosting your application on DigitalOcean is an easy way for teams to deploy and scale applications without worrying about the details of the infrastructure. But what happens when your application starts causing bottlenecks and you need to track down the root cause?
In this article, we’ll look at how SolarWinds® AppOptics™ works together with DigitalOcean to help you identify and fix performance issues with your application. We’ll create a simple website in Python and use AppOptics to peek into and solve its performance issues.
Our Sample Setup
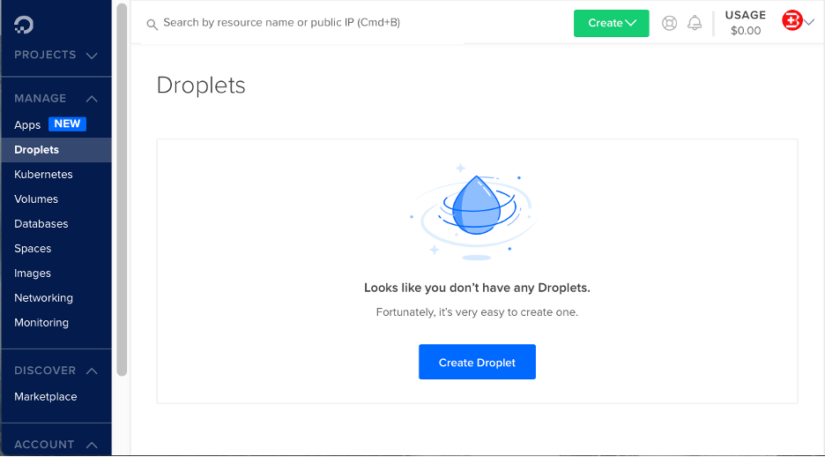
First, let’s create a sample app and deploy it on DigitalOcean. After you log in or create a new account, click Create Droplet. A Droplet is a VM running on top of virtualized hardware.
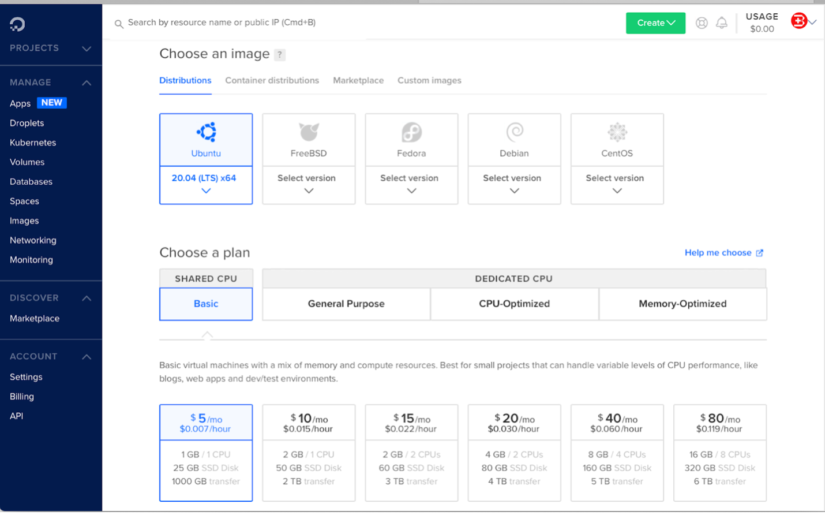
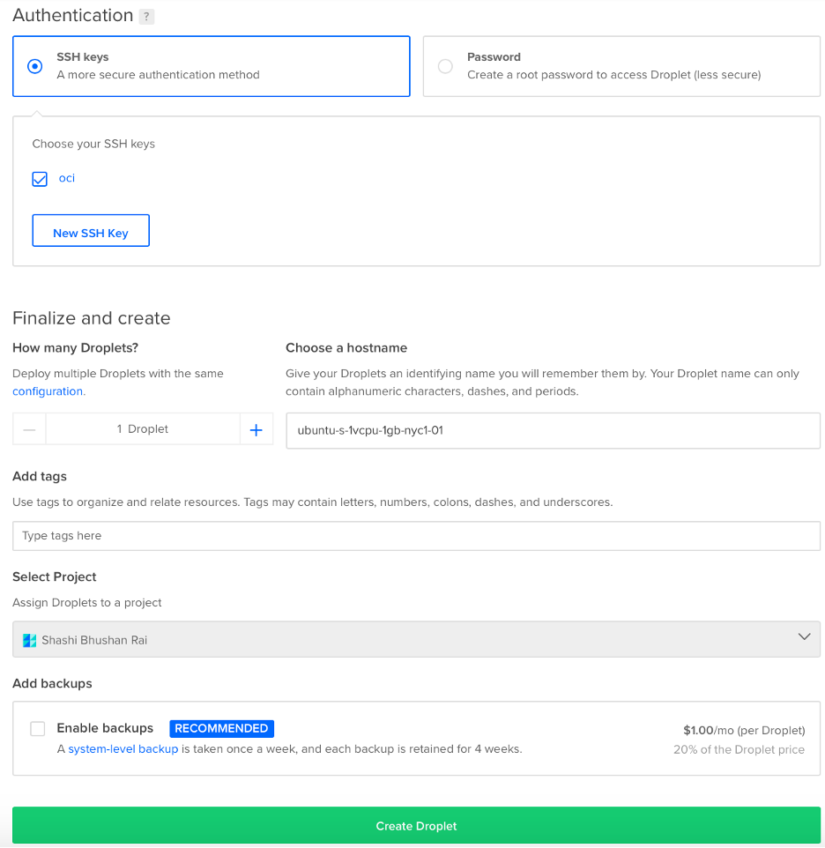
For this example, let’s select Ubuntu, the basic plan (shared CPU), and the $5/month virtual machine (as shown below) to keep the cost of our website low.
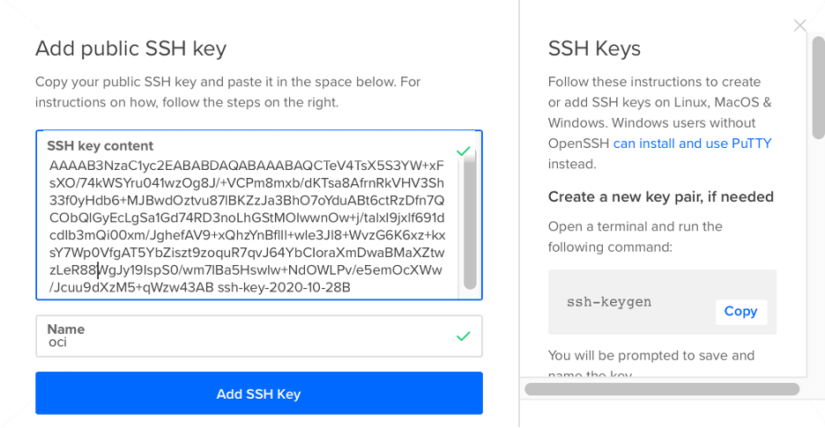
We’ll keep the defaults on all the other parameters. Since we’ll want to access the new host remotely, we must generate a secure shell key. In the Authentication section, click New SSH Key and paste in your public SSH key and name. Then, click Add SSH Key.
Now click Create Droplet to provision a host.
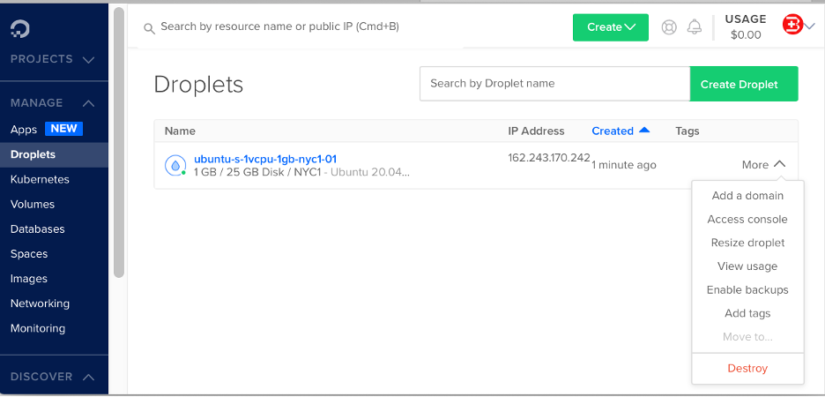
We now have a Droplet up and running. Click back on the Droplets menu on the panel on the left side to see the provisioned Droplet.
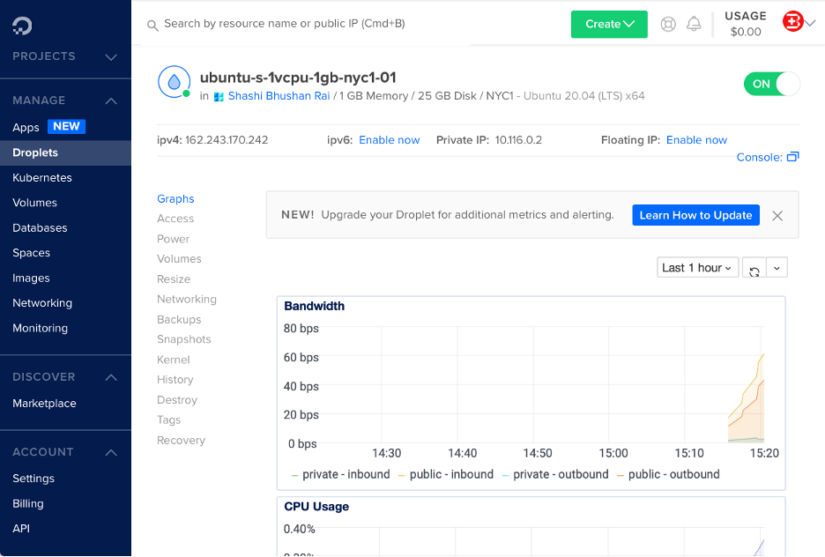
Click on your new Droplet to see further details (as shown below).
Now, let’s update the system and install some prerequisite packages for our project. First, SSH to your host.
$ ssh -i ./my-ssh-private.key root@162.243.170.242Then, issue this command:
$ apt update && apt-get upgrade -y && apt-get install python3.8 python3-pipLet’s open the default HTTP port on this host, since we’d like our web application to be accessible to the internet.
$ sudo ufw allow 80And finally, we need to deploy our sample app.
Install Flask (a Python framework for web applications) using the pip3 command.
$ pip3 install flaskNow, create a folder for your web application.
$ mkdir flask
$ cd flask
Open your text editor and save a file named app.py with the following content:
from flask import Flask

# the flask app
app = Flask(__name__)

@app.route('/')
def hello():
   return "Hello World!"

if __name__ == '__main__':
   app.run(host='0.0.0.0', port=80)
Now, start your web application.
$ python3 app.py
* Serving Flask app "app" (lazy loading)
 * Environment: production
   WARNING: This is a development server. Do not use it in a production deployment.
   Use a production WSGI server instead.
 * Debug mode: off
 * Running on http://0.0.0.0:80/ (Press CTRL+C to quit)
Open another terminal window on your desktop and connect to the web application by issuing the command below. (The IPv4 address belongs to the remote host on DigitalOcean we created earlier.)
$ curl 162.243.170.242If you see, “Hello World!” then we have our example site up and running, and we’re all set!
For this article, let’s inject a little bad code into our sample app to mimic what we might see in a real-life production situation.
Connecting AppOptics to Our Application
First, however, we need a way to monitor our app. Because the application is deployed to a cloud provider, it can be difficult at times to truly understand how our application is behaving and why. But by using SolarWinds AppOptics, we can easily gain this insight. AppOptics is a cloud-hosted, enterprise-grade application performance monitoring (APM) solution and infrastructure monitoring tool for hybrid IT environments.
Let’s connect AppOptics to our example. You can sign up for a free trial here. Once you log in, you should see the main screen.
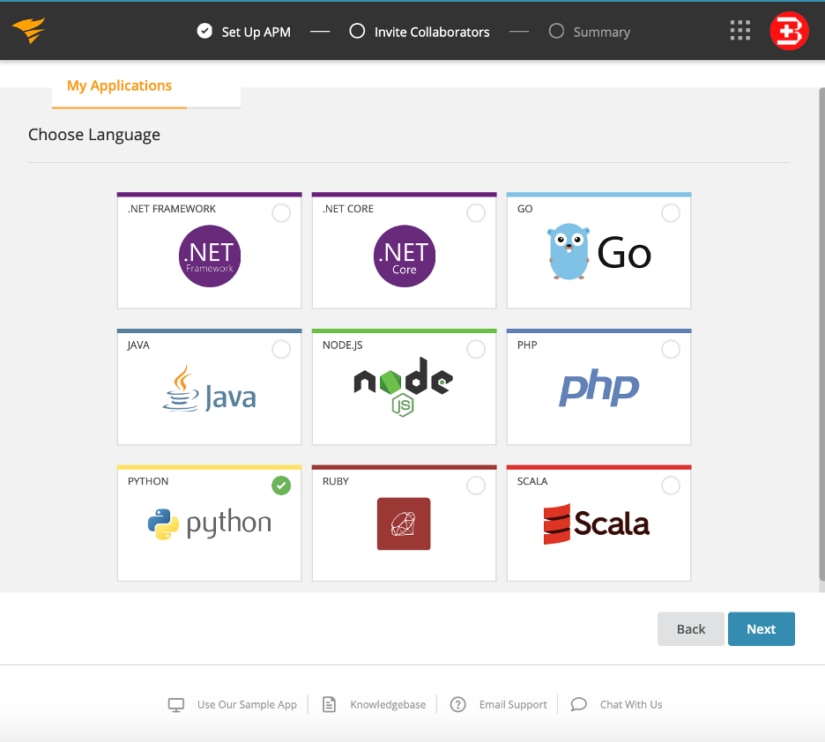
Click Set up APM. Then, select Python and click Next.
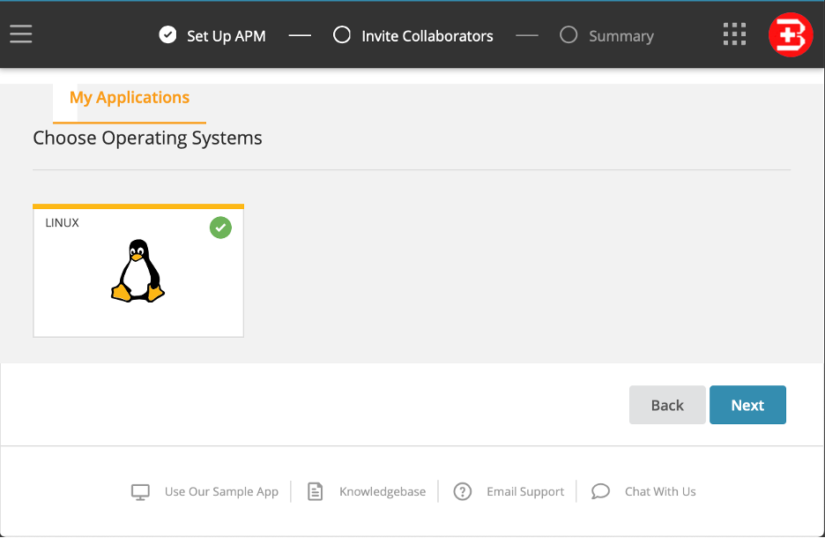
We’ll choose Linux here (since we’ve deployed a Python web application on Ubuntu Linux) and click Next.
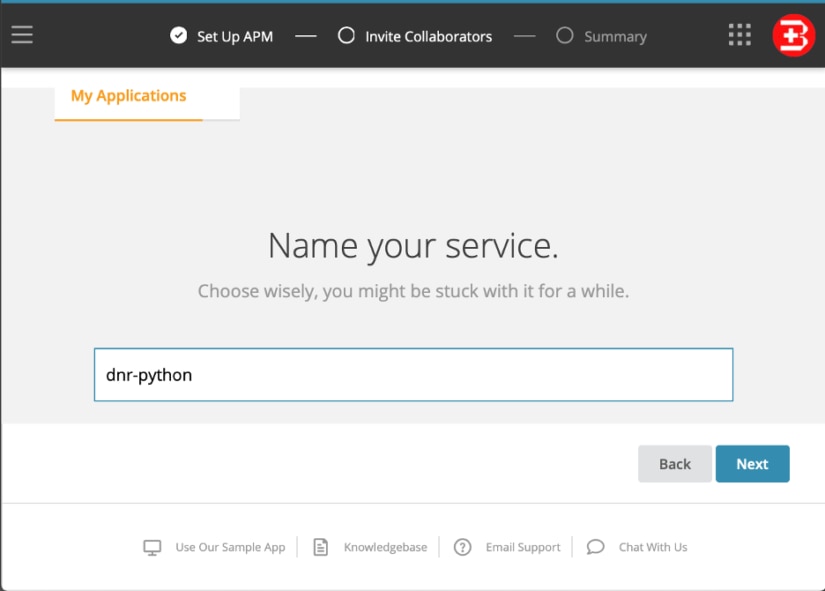
Now, type a service name. (I’ll use dnr-python.)
Now, we need to set up our AppOptics Python Agent. Since our Ubuntu operating system (OS) has pip3 (instead of the pip command), let’s log into our DigitalOcean remote host and issue the following commands:
$ pip3 install appoptics-apmCopy the export instructions from number two (as shown below). Note at the bottom of the screen that AppOptics is currently “Waiting for connection.” This means our AppOptics Python Agent has not yet connected to our app.
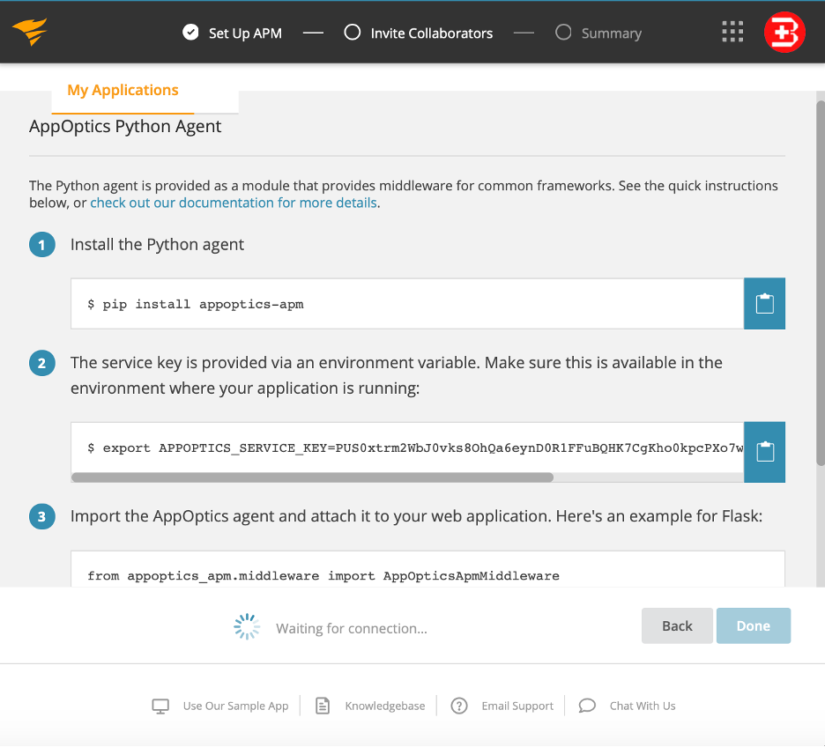
Set the APPOPTICS_SERVICE_KEY using the copied value. dnr-python refers to the service name we selected earlier.
$ export APPOPTICS_SERVICE_KEY=xxx:dnr-pythonNow update the web application file app.py with the following content and rerun the web application server:
from appoptics_apm.middleware import AppOpticsApmMiddleware
from flask import Flask

# the flask app
app = Flask(_name_)
app.wsgi_app = AppOpticsApmMiddleware(app.wsgi_app)

@app.route('/')
def hello():
	return "Hello World!"

if _name_=='_main_':
	app.run(host='0.0.0.0', port-80)
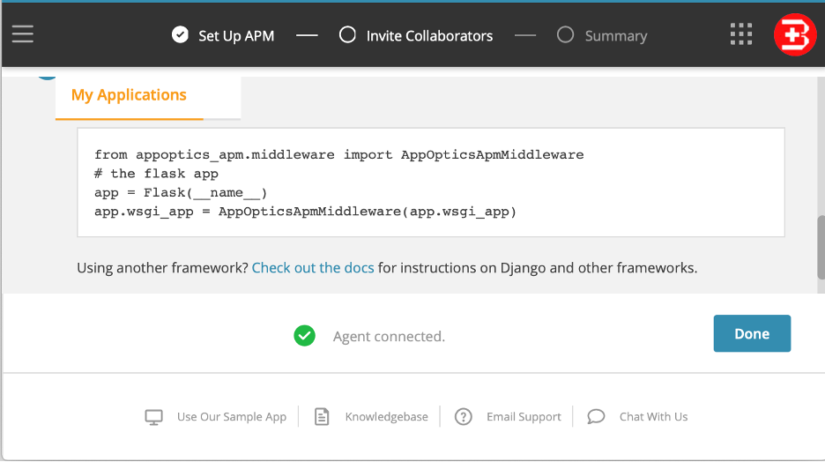
As you can see above, we changed the code to include the AppOptics middleware library. Now, restart the web application (in the background for now).
$ python3 app.py &Notice at the bottom of the screen our AppOptics Python Agent has connected! Click Done.
You should now see the below screen, which lists the performance metrics of our simple application. Currently, of course, our application has no performance issues or alerts. We’ll change this soon.
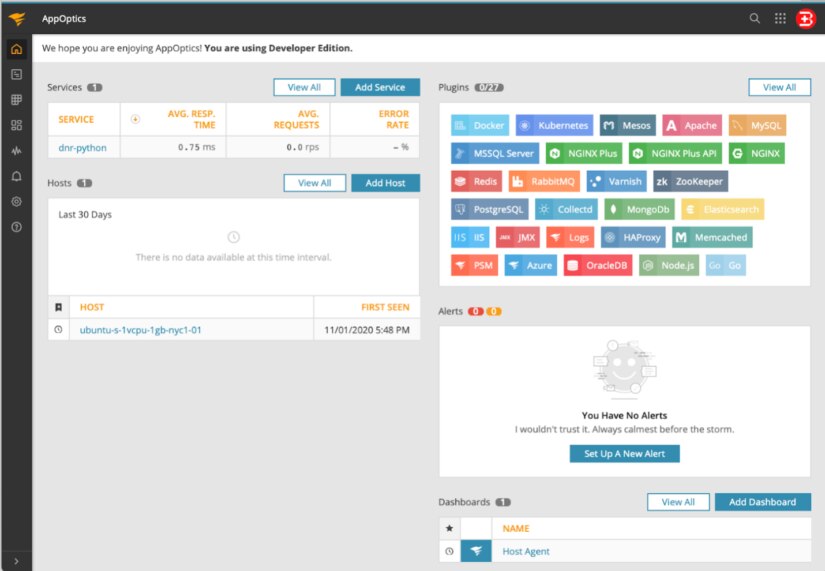
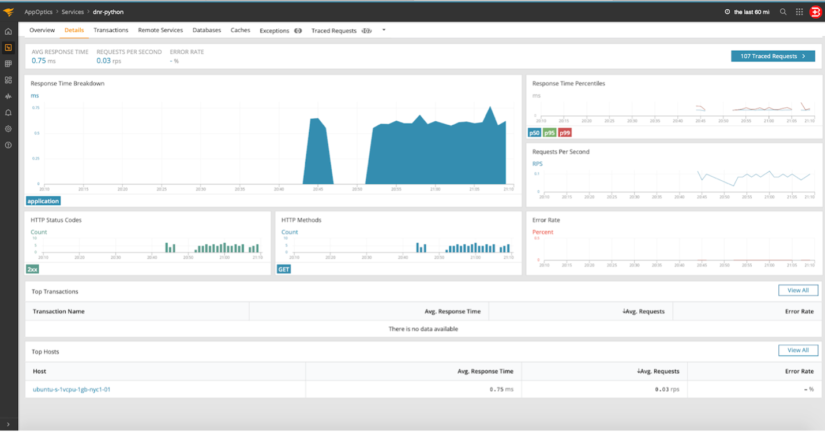
You can also click on the dnr-python service name to see more details. For example, here we can see the average response time is 0.75 milliseconds for HTTP requests.
To generate some simple metrics, let’s create some traffic every 10 seconds in a spare terminal:
while true; do curl -s http://162.243.170.242 > /dev/null; sleep 10; doneSolving Application Bottlenecks Using AppOptics
Now that we’re all set up, let’s get to the fun part. We’re going to artificially cause some bottlenecks in our application and use AppOptics to identify, diagnose, and fix them.
Breaking the Application
We’ll make two changes to cause performance issues in our web application. First, let’s create an unacceptably slow response time by adding a five-second delay right before we return “Hello World.”
from appoptics_apm.middleware import AppOpticsApmMiddleware
from flask import Flask
import time

# the flask app
app = Flask(_name_)
app.wsgi_app = AppOpticsApmMiddleware(app.wsgi_app)

@app.route('/')
def hello():
	time.sleep(5) # sleep for 5 seconds
	return "Hello World!"

if _name_=='_main_':
	app.run(host='0.0.0.0', port-80)
Second, let’s add a large workload to our website. We’ll update our previous test to continuously send HTTP requests to our site every second.
while true; do for i in {1..10}; do curl -s http://162.243.170.242 > /dev/null & done; sleep 1; doneDeploying Host-Level Agents
One last step is to set up host-level agents on the DigitalOcean infrastructure (the Ubuntu server).
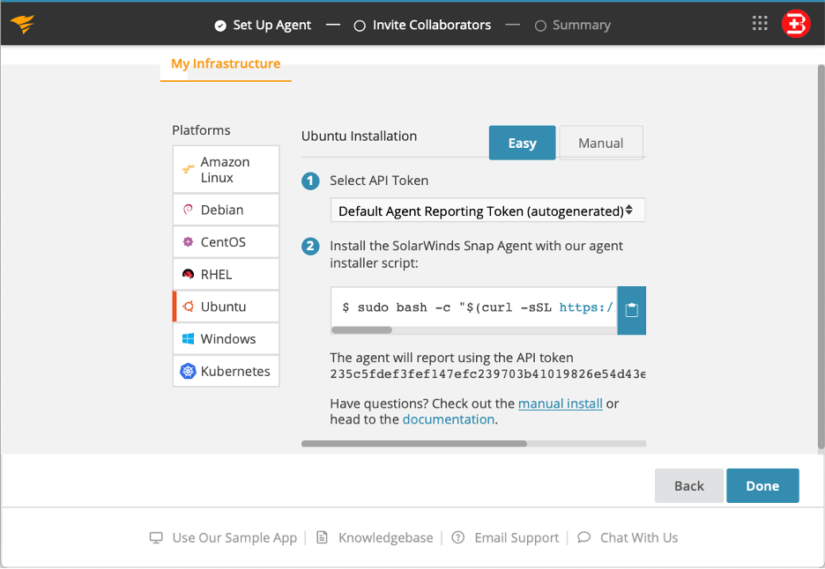
Copy step two above to set up the host-level agents.
$ sudo bash -c "$(curl -sSL https://files.solarwinds.cloud/solarwinds-snap-agent-installer.sh)" -s --token xxxxxDetecting Performance Bottlenecks Using AppOptics
Now, when we view our metrics on AppOptics, we see a major difference. The response time for our application is 74.33% higher than before. This isn’t good!
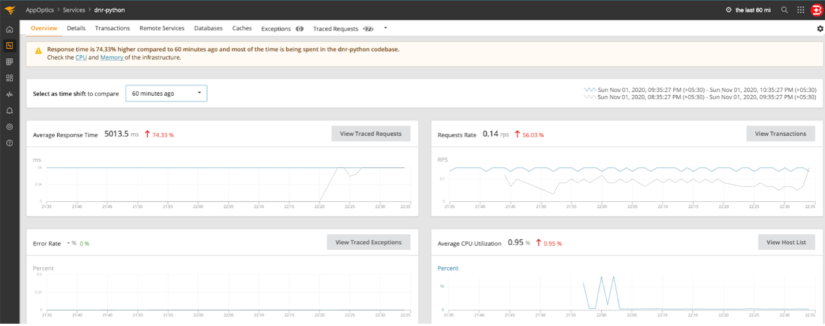
We can see the degradation with a little more clarity by changing the time window (in the upper-right corner, near the search icon) from 60 minutes to 6 hours and looking at the Details tab.
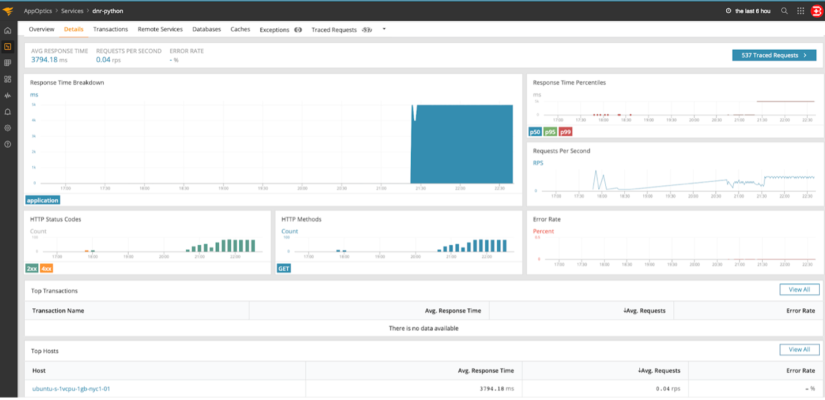
Both charts show response time has greatly increased, which means our website is now drastically slow. Also, the middle chart on the right side shows the load (requests per second) on the website has been increasing over time. But why? AppOptics can help us figure this out. Let’s distinguish between application-level issues and infrastructure issues by clicking the host name link at the bottom, which will open this window:
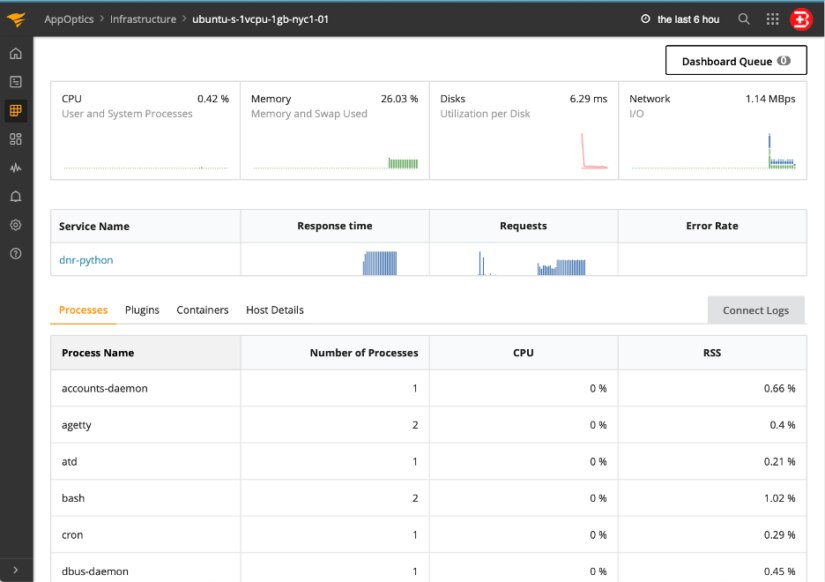
It’s clear from the above charts our website isn’t slow due to the DigitalOcean infrastructure, since the CPU, memory, disk, and network consumption are quite low compared to the amount of resources provisioned. Perhaps there’s something wrong in the application itself. Click on the dnr-python service name link (on the left side above).
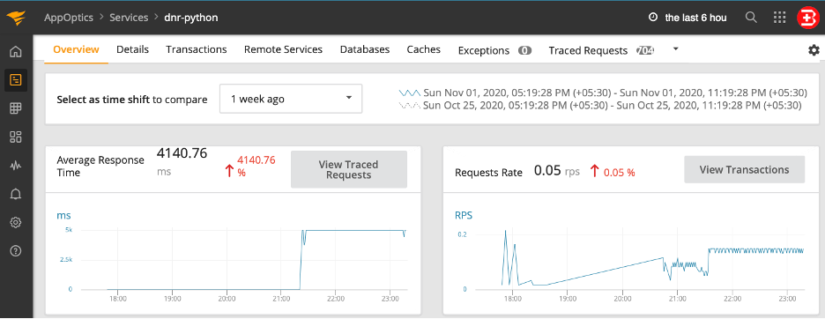
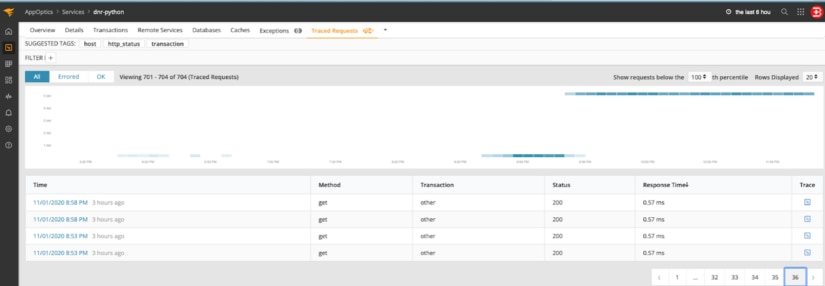
We can see in the Overview tab the HTTP get requests slowed down at 9:20 p.m. After clicking View Traced Requests, we can see this:
We can see a significant difference in response time.
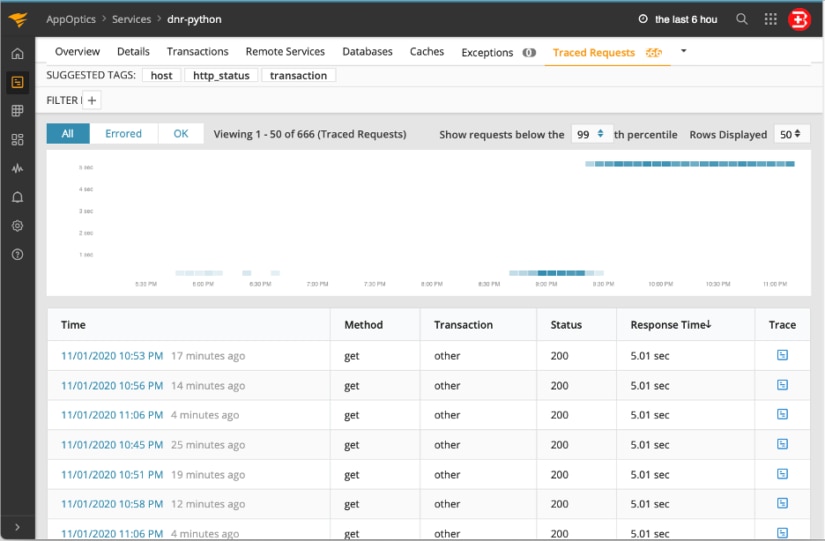
Because we have a clear delineation between good latency and bad latency starting at 9:20 p.m.—and a recent code deployment to match—AppOptics told us to go back to our source code and see what has changed or what could be happening.
Tips on Fixing Performance Bottlenecks
Since our test scenario shows an application-level performance issue, we’ll need to ask our software developers for help to resolve the problem. Some of the approaches they might take include the following:
- Look for stalls (response time) in the AppOptics dashboard. If the values are high, there might be a resource constraint (threads or socket/database connections) in your application. If the host is reachable but the application isn’t responding, there might be a deadlock situation happening.
- Look for growth in key performance indicators (e.g., requests per second) in the AppOptics dashboard. If memory consumption is growing non-linearly, you might have memory leaks.
- If you suspect the issue is related to a lack of provisioned infrastructure resources, your system administrators may need to change your infrastructure settings. This type of data is available from host-agent charts or through other tools (such as SolarWinds Loggly® or SolarWinds Papertrail™) you can easily integrate with AppOptics.
Precautionary Measures for Performance
It’s important to instrument your enterprise application and the hosting infrastructure with suitable performance monitoring tools. This will allow you to gather metrics on time and diagnose problems quickly, which will not only help with real-time analysis for problems and root cause analysis but can also be indicative of potential issues down the road. Issues from memory leaks to organic growth are easily identified with APM metrics and can help your business units determine the right road for growth as well as sprint planning to handle progressive bugs.
Be wary, though—monitoring everything is a quick road to overburdening your teams with alarm fatigue and is a surefire way to blow through your budgets. Google has published some excellent reading on which metrics you should monitor. Starting with these metrics as the foundation for your monitoring solution is a great way to ensure sufficient coverage in your alerting while growing into the SolarWinds suite.
Conclusion
DigitalOcean is the ideal cloud platform for teams to deploy and scale applications. However, when you begin to see bottlenecks in your application and aren’t sure why, AppOptics can help you track down the root cause, giving your team an at-a-glance understanding of all your services. Together, DigitalOcean and AppOptics are the perfect combination for teams to quickly deploy and troubleshoot their applications.
If you haven’t experienced the simple-to-install and easy-to-use SolarWinds AppOptics, maybe now is the time. Sign up for a 30-day free trial.