


Introduction
On January 4th, a subset of measurements for several Librato and AppOptics time-series aggregation workloads (1 minute, 15 minute, and 1 hour), as well as associated alerts on these measurements, were delayed from 20:15:00 UTC to 23:30:00 UTC. One workload in particular (1 minute aggregations) took an additional 1.75 hours to complete processing the backlog and publishing to our Cassandra time-series storage layer, finishing at January 5 01:15:00 UTC. Real-time measurements (last 60 minutes views) remained operational.
This outage was not caused by Meltdown and Spectre, but it did occur on AWS Meltdown patch day (which made everything that much more enjoyable). The underlying defect was exposed as we attempted to tune systems in reaction to the Meltdown patch.
Trigger and Root Cause
While performing a rolling restart of one of our primary 0.10.2.0 Kafka clusters, we encountered the issue (https://issues.apache.org/jira/browse/KAFKA-5413) Log cleaner fails due to large offset in segment file on two brokers. On restart, this caused consumers on some topics and partitions to be blocked for nearly 40 minutes while the __consumer_offset log segments were compacted.
Timeline of Events
Earlier in the day, and discussed in more detail in Mike Heffner’s blog post, Visualizing Meltdown on AWS, we experienced changes in behavior on several systems as the Meltdown patch was applied throughout AWS. Our custom time series database was especially affected. This system consumes data directly from Kafka and uses a variety of compression techniques to efficiently store and serve time series data.
One way we determine the health of this system is to monitor the end-to-end lag for all streams it consumes. When measurements are received at our API, they are time-stamped and sent to Kafka. As we consume messages at the time series database, we calculate the latency per measurement by taking the difference of wall time at ingestion and the timestamp marked at the API. We then use this data to determine the average/minimum/maximum and percentiles of latency per topic and partition being consumed.
At approximately 17:00:00 UTC, we were alerted to an increase in latency on some of our time series database tiers.

After analyzing additional metrics for the tier, including throughput and requests/sec., we surmised that increasing the consumer batch size might increase throughput and improve tail latencies. We conducted some testing in staging, then deployed the increased batch size change to production at 18:30:00 UTC. Performance improved at this point.
During the course of this investigation and in conjunction with analysis of the Meltdown patch, we noticed a marked decrease in the Kafka NetworkProcessorAvgIdlePercent metric.
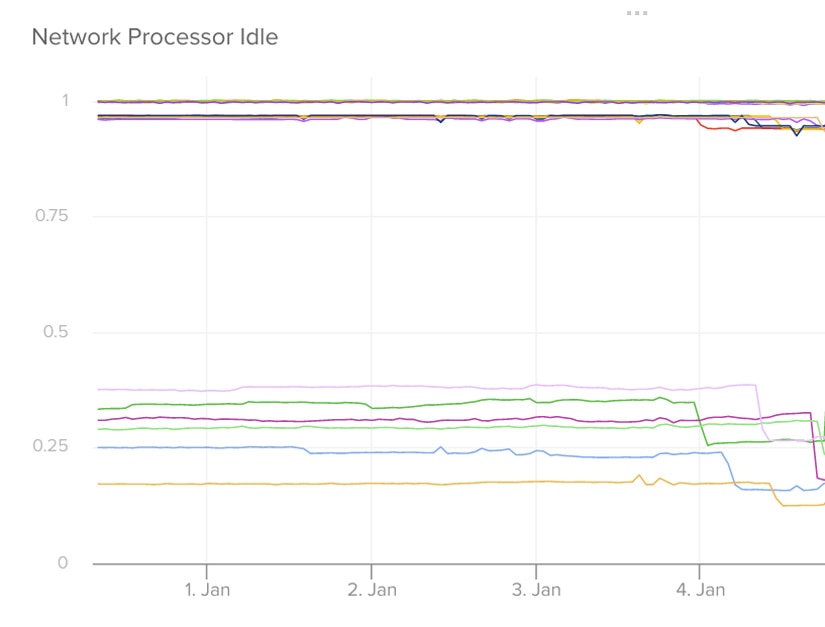
The Kafka documentation notes that, ideally, this value should be greater than 30%. Given the increase in lag we experienced at various tiers and rumored potential impact of the Spectre and Meltdown patch to network-dependent workloads, we decided to increase the num.network.threads on the brokers.
After testing in staging and on a canary in production, we observed an improvement in the NetworkProcessorAvgIdlePercent metric, and decided to roll out this change to the rest of the production Kafka tiers. At approximately 20:15:00 UTC, while in the midst of our rolling restart of the Kafka tier, our alerting system detected a growing backlog of pending messages to be processed at our time series aggregation tiers.
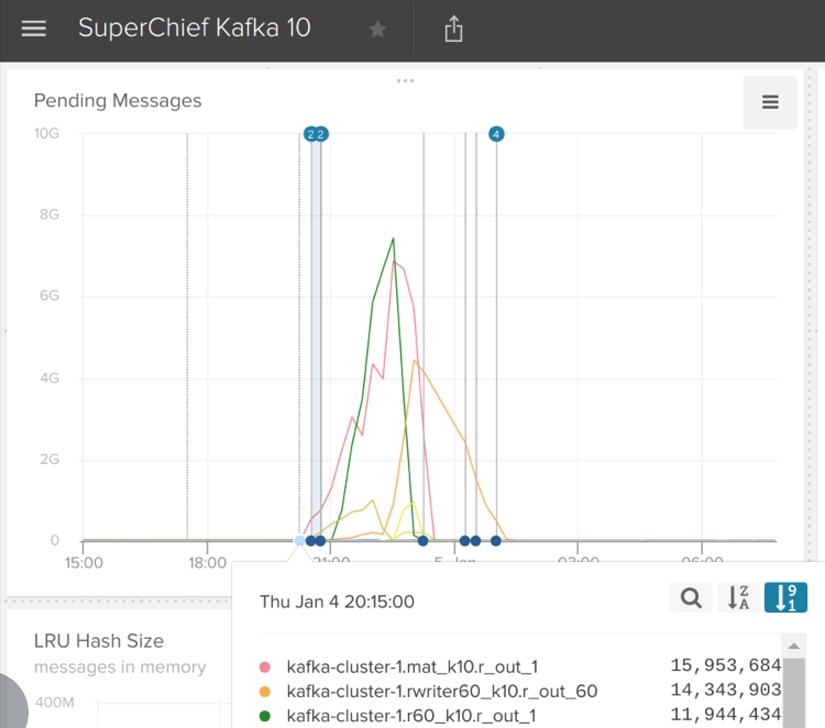
The time series aggregation tiers are distributed stream processing workloads running on our in-house developed stream processing system known as “SuperChief.” There are over 20 unique SuperChief-based workloads running on various clusters. These services consume data from Kafka, perform computations, and write the data back out to Kafka or some other sink.
One way we monitor the health of these services is by tracking pending messages waiting in Kafka. We periodically check the last written offset in Kafka for a topic and partition, and the last read offset by each SuperChief workload by topic and partition. After inspecting the rest of the obvious available metrics and not finding an immediate cause for the slowdown, we checked our Papertrail logs for these workloads.
The workloads with growing backlog were all spinning in a tight loop with similar messages to the following.
Jan 04 22:38:32 superchief-r60-k10-1-prodvpc superchief.log: INFO 2018-01-04 22:38:32,217 o.a.k.c.c.i.AbstractCoordinator: Marking the coordinator ip-172-26-22-192.ec2.internal:9092 (id: 2147482644 rack: null) dead for group r60_k10-r_out_1
Jan 04 22:38:32 superchief-r60-k10-1-prodvpc superchief.log: INFO 2018-01-04 22:38:32,295 o.a.k.c.c.i.AbstractCoordinator: Discovered coordinator ip-172-26-22-192.ec2.internal:9092 (id: 2147482644 rack: null) for group r60_k10-r_out_1.
Jan 04 22:38:32 superchief-r60-k10-4-prodvpc superchief.log: INFO 2018-01-04 22:38:32,235 o.a.k.c.c.i.AbstractCoordinator: Discovered coordinator ip-172-26-22-192.ec2.internal:9092 (id: 2147482644 rack: null) for group r60_k10-r_out_1.

...
By looking at the logs, we were able to isolate two particular brokers. We initially misinterpreted these messages as an indication of some sort of split-brain. After verifying additional metrics, zookeeper data, network connectivity, and ISR information, we failed to find evidence for this condition being induced by split-brain. We then attempted to back out our changes and restart the problematic brokers, but this also failed to resolve the issue.
There were no obvious exceptions in Kafka logs, but they were filled with messages about the __consumer_offset log. These messages correlated with our consumers being unable to make progress, as they require a coordinator for storing watermark offsets back in Kafka.
Jan 04 22:42:05 kafka10-c1-1-prodvpc output.log: [2018-01-04 22:42:04,612] INFO Cleaner 0: Swapping in cleaned segment 4052971719 for segment(s) 4052971719 in log __consumer_offsets-1. (kafka.log.LogCleaner)
Jan 04 22:42:05 kafka10-c1-1-prodvpc output.log: [2018-01-04 22:42:04,613] INFO Cleaner 0: Cleaning segment 4054067521 in log __consumer_offsets-1
However, our producers were minimally affected. Producers do not need to store offsets, so they continued unabated, adding to the growing backlog. From looking at the logs and metrics, we now understand that the __consumer_offsets and LogCleaner were the culprits. At the time, though, it was not clear if brokers were simply under-provisioned with the advent of the Meltdown patch and exhibiting some new, emergent behavior under the current load.
Restoring Service
As the data was not lost, just delayed, we decided to switch priorities and focus on restoring time series aggregations for all new incoming data. This way, new aggregations could continue processing, and when we resolved the consumer issue, we could backfill the missing hour of aggregations. This is not too difficult for us to do because we run multiple Kafka clusters in an active-active HA configuration. That is worthy of a blog post in its own right, but it is too long to discuss here. At 22:15:00, we began a configuration change ship to the API that shifted writes from the primary Kafka cluster to our secondary cluster. The time series aggregation tier automatically picked up this change and read from the secondary Kafka cluster.


As soon as the ship completed at 22:36:00 UTC, coordinator error messages subsided and several workloads began to recover, burning down the backlog of pending messages in Kafka.

Postmortem Analysis
Unsatisfied that we hadn’t found the root cause for this outage, we set out to digging through the logs looking for anything we might have missed. Quickly, this turned up.
Jan 04 22:37:27 kafka10-c1-3-prodvpc output.log: [2018-01-04 22:37:27,001] INFO [Group Metadata Manager on Broker 1003]: Finished loading offsets from __consumer_offsets-21 in 2384642 milliseconds. (kafka.coordinator.GroupMetadataManager
Yes, unfortunately, that’s 39 minutes, and it correlates with the time the consumers recovered. We dug through the documentation for offset storage management and metrics, and found that the kafka.log.LogCleanerManager.maxdirtypercent metric spiked to 99% for the two brokers in question back on December 15.
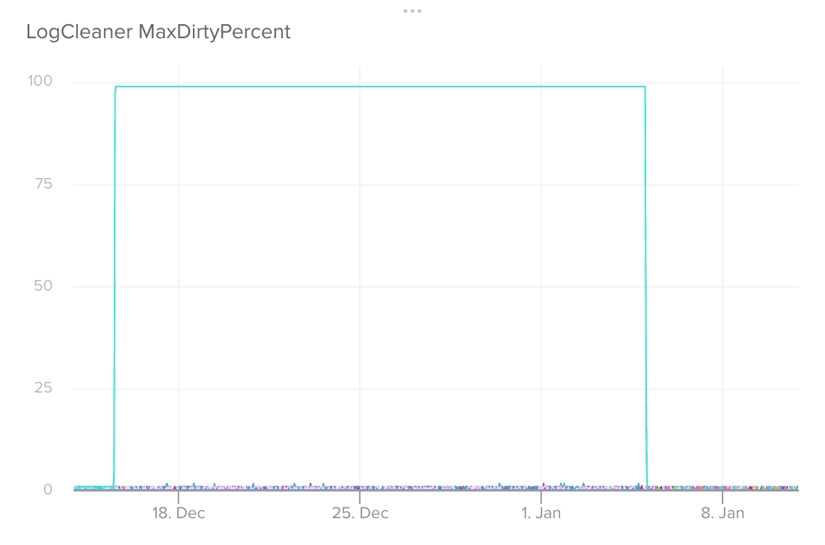
The Kafka Log Cleaner is responsible for log compaction and cleaning up old log segments. Using Papertrail, we searched for LogCleaner and found that on December 15, the LogCleaner had shut down, leading us to the following defect https://issues.apache.org/jira/browse/KAFKA-5413.
Dec 15 12:56:54 kafka10-c1-1-prodvpc output.log:  java.lang.IllegalArgumentException: requirement failed: largest offset in message set can not be safely converted to relative offset.
Dec 15 12:56:54 kafka10-c1-1-prodvpc output.log:      at scala.Predef$.require(Predef.scala:224)
Dec 15 12:56:54 kafka10-c1-1-prodvpc output.log:      at kafka.log.LogSegment.append(LogSegment.scala:109)
Dec 15 12:56:54 kafka10-c1-1-prodvpc output.log:      at kafka.log.Cleaner.cleanInto(LogCleaner.scala:478)
Dec 15 12:56:54 kafka10-c1-1-prodvpc output.log:      at kafka.log.Cleaner$$anonfun$cleanSegments$1.apply(LogCleaner.scala:405)
Dec 15 12:56:54 kafka10-c1-1-prodvpc output.log:      at kafka.log.Cleaner$$anonfun$cleanSegments$1.apply(LogCleaner.scala:401)
Dec 15 12:56:54 kafka10-c1-1-prodvpc output.log:      at scala.collection.immutable.List.foreach(List.scala:381)
Dec 15 12:56:54 kafka10-c1-1-prodvpc output.log:      at kafka.log.Cleaner.cleanSegments(LogCleaner.scala:401)
Dec 15 12:56:54 kafka10-c1-1-prodvpc output.log:      at kafka.log.Cleaner$$anonfun$clean$4.apply(LogCleaner.scala:363)
Dec 15 12:56:54 kafka10-c1-1-prodvpc output.log:      at kafka.log.Cleaner$$anonfun$clean$4.apply(LogCleaner.scala:362)
Dec 15 12:56:54 kafka10-c1-1-prodvpc output.log:      at scala.collection.immutable.List.foreach(List.scala:381)
Dec 15 12:56:54 kafka10-c1-1-prodvpc output.log:      at kafka.log.Cleaner.clean(LogCleaner.scala:362)
Dec 15 12:56:54 kafka10-c1-1-prodvpc output.log:      at kafka.log.LogCleaner$CleanerThread.cleanOrSleep(LogCleaner.scala:241)
Dec 15 12:56:54 kafka10-c1-1-prodvpc output.log:      at kafka.log.LogCleaner$CleanerThread.doWork(LogCleaner.scala:220)
Dec 15 12:56:54 kafka10-c1-1-prodvpc output.log:      at kafka.utils.ShutdownableThread.run(ShutdownableThread.scala:63)
Dec 15 12:56:54 kafka10-c1-1-prodvpc output.log:  [2017-12-15 12:56:53,872] INFO [kafka-log-cleaner-thread-0], Stopped  (kafka.log.LogCleaner)
The __consumer_offset logs had been growing ever since, and after restarting the broker, the LogCleaner had to compact two weeks’ worth of log segments.

Lessons Learned
During this outage, several things went well. Proper instrumentation and alerting was in place to spot the delay and quickly notify the team. Having powerful log aggregation in place with Papertrail made it easy to search logs across the impacted infrastructure. No interruption at the API tier meant no data loss for our users, and the Kafka HA environment allowed for quick failover.
Conversely, we identified some things that needed improvement. We did not pay close enough attention to the critical issue list for our current Kafka version. We had no alerting on the maxdirtypercent metric, and simply relying on storage capacity alerting was not enough.
Since the outage, we’ve performed several actions. We’ve upgraded all clusters to Kafka 0.11.2, and have added finer-grained log sizes and maxdirtypercent alerts. Finally, we’ll be keeping better track of the critical Kafka bugs list.
Come work with us on large scale systems.
The AppOptics and SolarWinds trademarks, service marks, and logos are the exclusive property of SolarWinds Worldwide, LLC or its affiliates. All other trademarks are the property of their respective owners.


