Note: This article was originally published on Librato, which has since been merged with SolarWinds® AppOptics™. Learn more about monitoring Docker performance using AppOptics.
When it comes to Docker container monitoring, using a dedicated tool provides a solution that you can reuse across all of your applications instead of building something specific for each. You also gain a partner dedicated to enhancing Docker container monitoring, which is invaluable for proactive issue detection, as well as in times of crisis.
The Theory of Monitoring
If you’ve ever developed software used by real production users—especially the paying type—then the importance of application monitoring should be obvious to you. At a simplistic level, the goal is to make sure the software you build is available for the people who use it, and if not, to let you know the “when” and “why.” However, it goes well beyond that. In his book, The High-Velocity Edge, Dr. Steven J. Spear explains how proper monitoring and the operational excellence that follows can be a competitive advantage. This requires a deeper look at monitoring than just alerting you to when problems occur, and involves the entire system and software stack.
First, you need to monitor the components of your system (i.e. databases, servers, networks) but also the system as a whole. Don’t stop at just individual components. InformationWeek reports that only about 10% of companies monitor up to 100% of their application and environment. The majority are in the 50% range. Although the backing survey is a few years old now, the point is that most companies don’t implement thorough monitoring. This also means that most companies aren’t taking a holistic view of their production systems, and as deployment strategies continue to evolve, this is more important than ever. For now, let’s begin with some basics.
A General Monitoring Strategy
Your application monitoring implementation should aim to report and answer three important questions when an issue occurs: What happened? Who is affected? How do we fix it? These are important parts of root-cause analysis because they help you isolate where the issue may be, determine how severe the issue is (are customers affected or not?) and how to resolve the issue immediately and effectively.
Personally, the approaches to monitoring that I’ve found most successful have the following traits:
- Monitor individual components and overall system availability and behavior
- Monitor metrics around application performance, response accuracy, and security (for users, data, and the company)
- Use of visualization where possible—what I call “status-at-a-glance”—via dashboards
- Make detailed logs available to everyone. Experience shows that people will indeed read them, so it’s important to make them usable
- Good monitoring has positive side-effects, such as helping new people learn complex systems faster
- Become proactive: The ultimate monitoring implementation is one that helps you predict, find, and resolve issues before your users do
- Bottom line: you need to monitor the full software stack of your application. This means the monitoring of physical servers, virtual servers, cloud services, and Docker containers need to be added to the list. Fortunately, there are tools and partners to help you. Let’s focus on Docker monitoring specifically.
What Makes Docker Monitoring Different?
It’s important to include every layer of your application’s environment, and the use of Docker affects your application monitoring significantly. As an analogy, I worked for a company that used virtualization in the early days. Simply monitoring the virtual OS metrics would show a very different picture than what was happening on the physical server it ran on. We saw that while the virtual OS seemed healthy in terms of I/O, memory and CPU usage, underlying constraints on RAM at the physical level (due to multiple virtual OS instances) would often impact application performance in ways that weren’t always clear or easily correlated.
Understanding when a physical server is stressed is one thing, but knowing if an individual Docker container is CPU-bound is another. This can be difficult to do, and it’s nearly impossible when monitoring the underlying server alone. There are Docker-specific monitoring considerations, including key metrics that need to be added to your logs and dashboards.
Docker Monitoring Metrics
Important Docker resource metrics to monitor and report include:
- Those CPU-related:
- Broken out by user time and system time, indicating where issues such as misconfiguration are a factor
- CPU core balancing: look for imbalances that indicate core contention across containers, as well as underutilized cores. CPU usage by container is configurable and can be reported via the following:
> cat /sys/fs/cgroup/cpuacct/docker/<ID>/cpuacct.stat
> cat /sys/fs/cgroup/cpuacct/docker/<ID>/cpuacct.usage_percpu
> cat /sys/fs/cgroup/cpuacct/docker/<ID>/cpuacct.usage - > cat /sys/fs/
CPU throttling at the container level, which indicates whether Docker has limited the amount of CPU usage for your application according to quota settings:cgroup/cpu/docker/<ID>/cpu.stat
- Those memory-related:
- Application memory usage by container (also called resident set size):
> cat /sys/fs/cgroup/memory/docker/<ID>/memory.usage_in_bytes - > cat /sys/fs/
Memory limits imposed (again, according to quota configuration):cgroup/memory/docker/<ID>/memory.failcnt - > cat /sys/fs/
Cache memory usage for disk caching:cgroup/memory/docker/<ID>/memory.stat - > cat /sys/fs/
Swap space usage by container:cgroup/memory/docker/<ID>/memory.memsw.usage_in_bytes
- Application memory usage by container (also called resident set size):
- I/O-related operations:
- Overall operations in a given time frame:
> cat /sys/fs/cgroup/blkio/docker/<ID>/ - > cat /sys/fs/
In terms of bytes:cgroup/blkio/docker/<ID>/blkio.throttle.io_service_bytes - Inbound and outbound network metrics
> cat /proc/<ID>/net/dev
- Overall operations in a given time frame:
You can find a comprehensive list of statistics on the Docker documentation site. Most of these metrics can be gathered from the file system, continuously live-streamed, or accessed programmatically via Docker monitoring APIs. However, going back to the monitoring best practices I listed above, tools and visual dashboards help tremendously. Let’s look at using Librato as a solution.
Monitoring Docker Containers Using Librato
Librato offers a Docker-specific monitoring tool that gathers all of the data outlined above, and more. Better yet, it follows the same set of best practices I’ve outlined by including a rich set of visualization dashboards (see Figure 1). With Librato, real-time container data is gathered and visualized immediately for quick decision-making by people both inside and outside of IT.
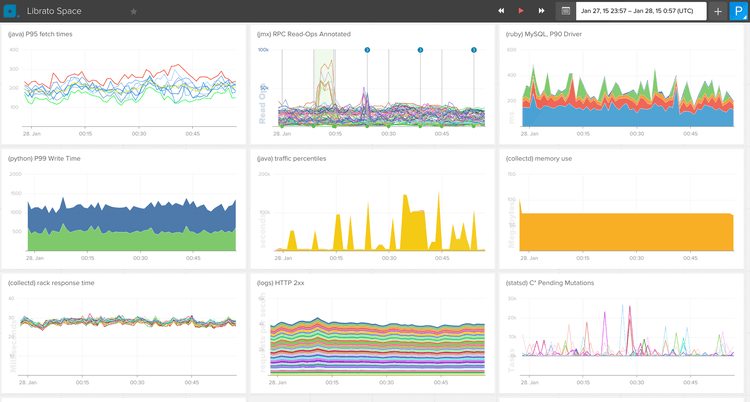
Librato works by installing a small agent that collects data and system-level metrics directly from the Docker daemon running on your system. This means you get container-level monitoring and visualization without having to modify your current Docker images. Existing dashboards and pre-configured data collection get you started right away, and can be customized to gather application-specific metrics as well. You can view statistics for all of Docker, zero in on a single container, view memory usage (see Figure 2), network traffic, and even filter by the type of data generated for deep insight at a glance.

Beyond the visualizations discussed, via a simple setup, you can easily achieve advanced system monitoring through signal processing (see Figure 3), such as data flow forensics and quality-of-service policy validation. This helps you understand how application changes will affect network behavior, underlying server performance, user impact, etc., before they take place. This is part of proactive best practices, helping you to improve your applications and SLAs, perform accurate network capacity planning, and improve your application deployments/upgrades (Figure 4).

Regardless of where you deploy your Docker containers (i.e. on-premises servers, private cloud, or the public cloud via Heroku, AWS, and so on) Librato gathers all the container and provider metrics, aggregates them, provides a unified visualization of the data, and allows you to set up customized rules to react to potential issues. This can include alerting the right individuals automatically, or implementing an automated response via tools and processes you already have in place.

Conclusion: Don’t Roll Your Own (or Be on Your Own)
When it comes to Docker container monitoring, using a dedicated tool such as Librato provides a single solution that you can reuse across all of your applications instead of building something specific for each application. You also gain a partner dedicated to enhancing Docker container deployment and usage monitoring, which is invaluable for both proactive issue detection and in times of crisis.


