Analysts and other industry experts have defined application performance monitoring as software that incorporates analytics, end-user experience monitoring, and a few other components, but this is just a small and basic part of the APM story. True APM is rich and nuanced, incorporating different approaches and tools for one common goal: keeping applications healthy and running smoothly.
Two Approaches to APM
How you use APM will depend on your agency’s environment. For example, you may prefer an APM approach that allows you to go inside underperforming applications and make changes directly to the code. In other cases, you may simply need to assess the overall viability of applications to help ensure their continued functionality. There are two very different methodologies that address both of these needs.
To solve a slow application problem, you may wish to dig down into the code itself to discover how long it takes for each portion of that code to process a transaction. From this, you’ll be able to determine, in aggregate, the total amount of transaction processing time for that application.
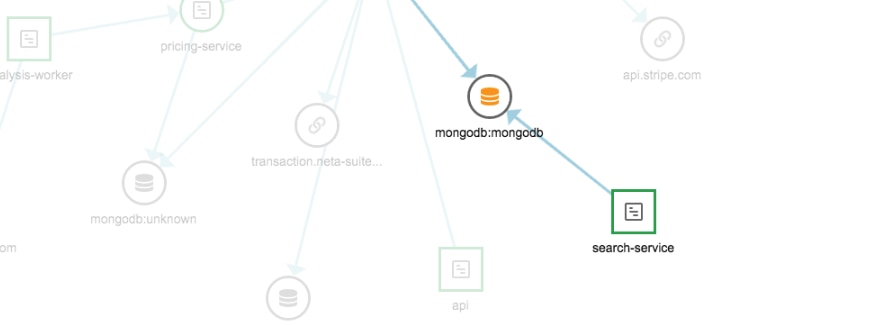
For this, you can use application bytecode instrumentation monitoring (ABIM) and Distributed Tracing. ABIM allows you to insert instrumentation into specific parts of the code. Monitoring processing times gives you information to accurately pinpoint where the problem exists and rectify the issue. For more complex application infrastructure that are distributed in nature, you can use Distributed Tracing to tag and track processes that go across multiple stacks and platforms. It’s a very specific and focused approach to APM, almost akin to a surgeon extracting a tumor.
Another, more general – though no less effective – approach is application interface performance management (AIPM). If ABIM is the surgeon’s tool, AIPM is something that a general practitioner might use.
AIPM allows you to monitor response times, wait times, and queue length, and provides near real-time visibility into application performance. You can receive instant alerts and detailed analytics regarding the root cause of problems. Once issues are identified, you can respond to them quickly and help your agency avoid unnecessary and costly application downtime.
Tools and Their Features
There are a number of different monitoring solutions on the market, and it can be hard to determine which technologies will best fit your agency’s unique needs. Most of them will do the basics – alerts, performance metrics, etc. — but there are certain specialized features you’ll also want to look out for:
Insight into all of your applications. Applications are the lifeblood of an agency, and you’ll need solutions that provide you with insight into all of them, preferably from a single dashboard or control point.
A glimpse into the health of your hardware. Hardware failure can cause application performance issues. You’ll need to be able to monitor server hardware components and track things like high CPU load and other issues to gain insight into how they may be impacting application performance.
The ability to customize for different types of applications. Different types of applications (for example, custom or home-grown apps) may have various monitoring requirements you’ll need tools that are adaptable depending on the applications in your stack.
As you can see, APM is far more intricate than some may have you believe, and that’s a good thing. You have far more resources at your fingertips than you may have thought. With the right combination of approaches and tools, you’ll be able to tackle even the trickiest application performance issues.


