Temporal Event Management
One constant in IT is change. You are constantly releasing new versions of your code to production, patching systems, and running backups. The important thing about these events, in relation to your APM tool, is that they will potentially change the behavior and performance of your application. In the simple case of patching systems and running nightly backups, you want to tell your APM tool not to raise alerts that could result from the temporary outage or degradation in performance. However, you want your APM tool to make note of new code releases and allow you to see when they are published to production.
It is a good idea to compare the performance of an application between releases because it can help you determine if your new release improved or hurt performance. A new release may have new features that add business value to your application, but you need to assess whether those new features impacted the performance of your application in such a way that could hurt your service-level agreements (SLAs).
Furthermore, changes may be subtle and introduce performance degradations that manifest over a long period of time. When you are later investigating a performance issue, knowing when releases were published to production can provide you with a lot of diagnostic insight. Additionally, if you generate good release notes for your releases, it can give you hints into where your performance issue may be and why it was introduced. For example, you may have added a new artificial intelligence capability to handle searches that do not contain specific keywords. In this case, the problem may only start occurring when users learn about your new capabilities and structure their searches accordingly.
The best way to keep on top of changes is to use automation to tie them into your monitoring system. Most applications are built in a Continuous Integration (CI) environment and many are built leveraging Continuous Delivery or Continuous Deployment (CD). These systems detect when source code is checked into a source code management system and then build the code, run a set of unit tests, and in the case of CD, they also run a set of integration tests to validate the build and then potentially publish the application to production. Usually, it’s as simple as adding one more step to deployment: invoke a service on your APM tool to record the code release. In this way, you can track releases without having to remember to do it.
But in order for this to be viable, you need your APM tool to expose an endpoint with which your CI server can integrate.
Intelligent Alerting
Alerting might sound like a simple issue: if something goes wrong, raise an alert. But unfortunately, alerting can be tricky. APM tools need to raise alerts, but only when things are truly behaving abnormally. The worst thing that you can do is raise false alerts or raise the same alert over and over.
“Intelligent” alerting means that your APM tool needs to be able to distinguish between abnormal conditions that mean something to your application and abnormal conditions that do not. This means that simple threshold-based alerting is not going to suffice. Your APM tool needs to monitor the behavior of your application, establish a baseline for what constitutes “normal,” allow you to customize how the baseline should be interpreted based on your business, and then evaluate real-time requests against the baseline.
At the end of the day, “intelligent” alerting means informing you about a problem when it is meaningful to your users. You do not want to wait until the response time is so bad that users are abandoning your site. Rather, you want to monitor metrics that are critical to your users and detect when they are not behaving correctly.
Custom Dashboards
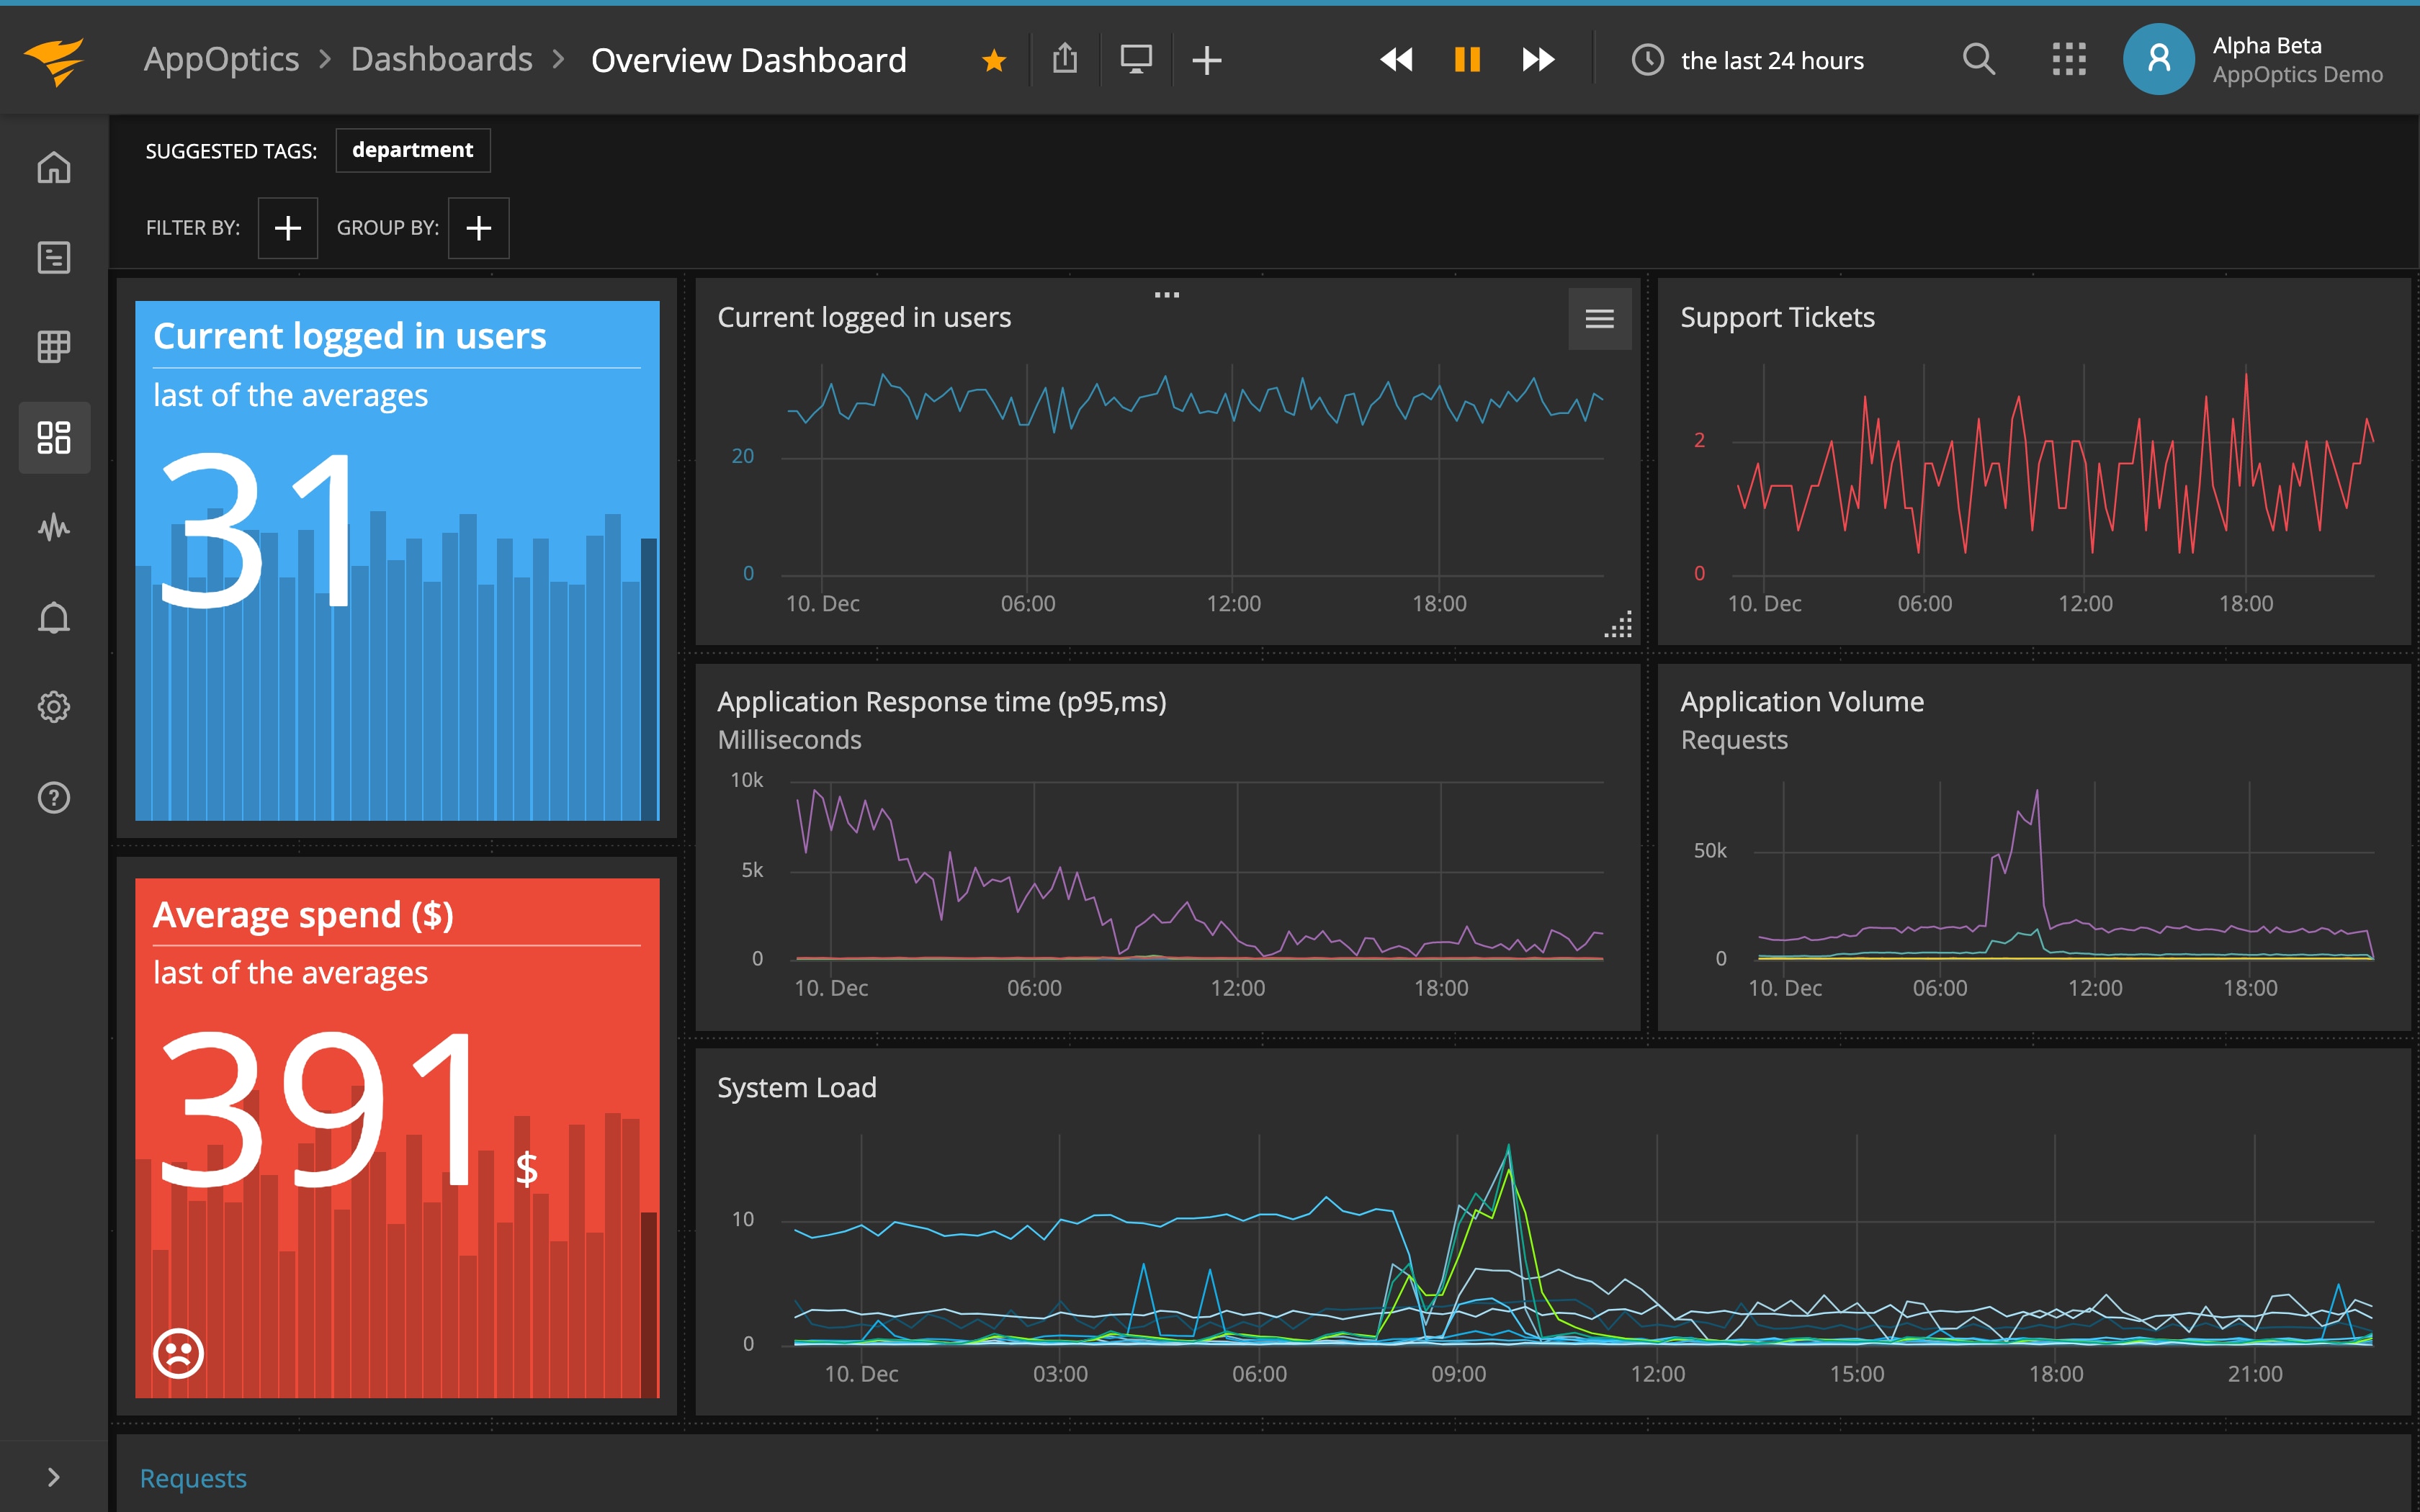
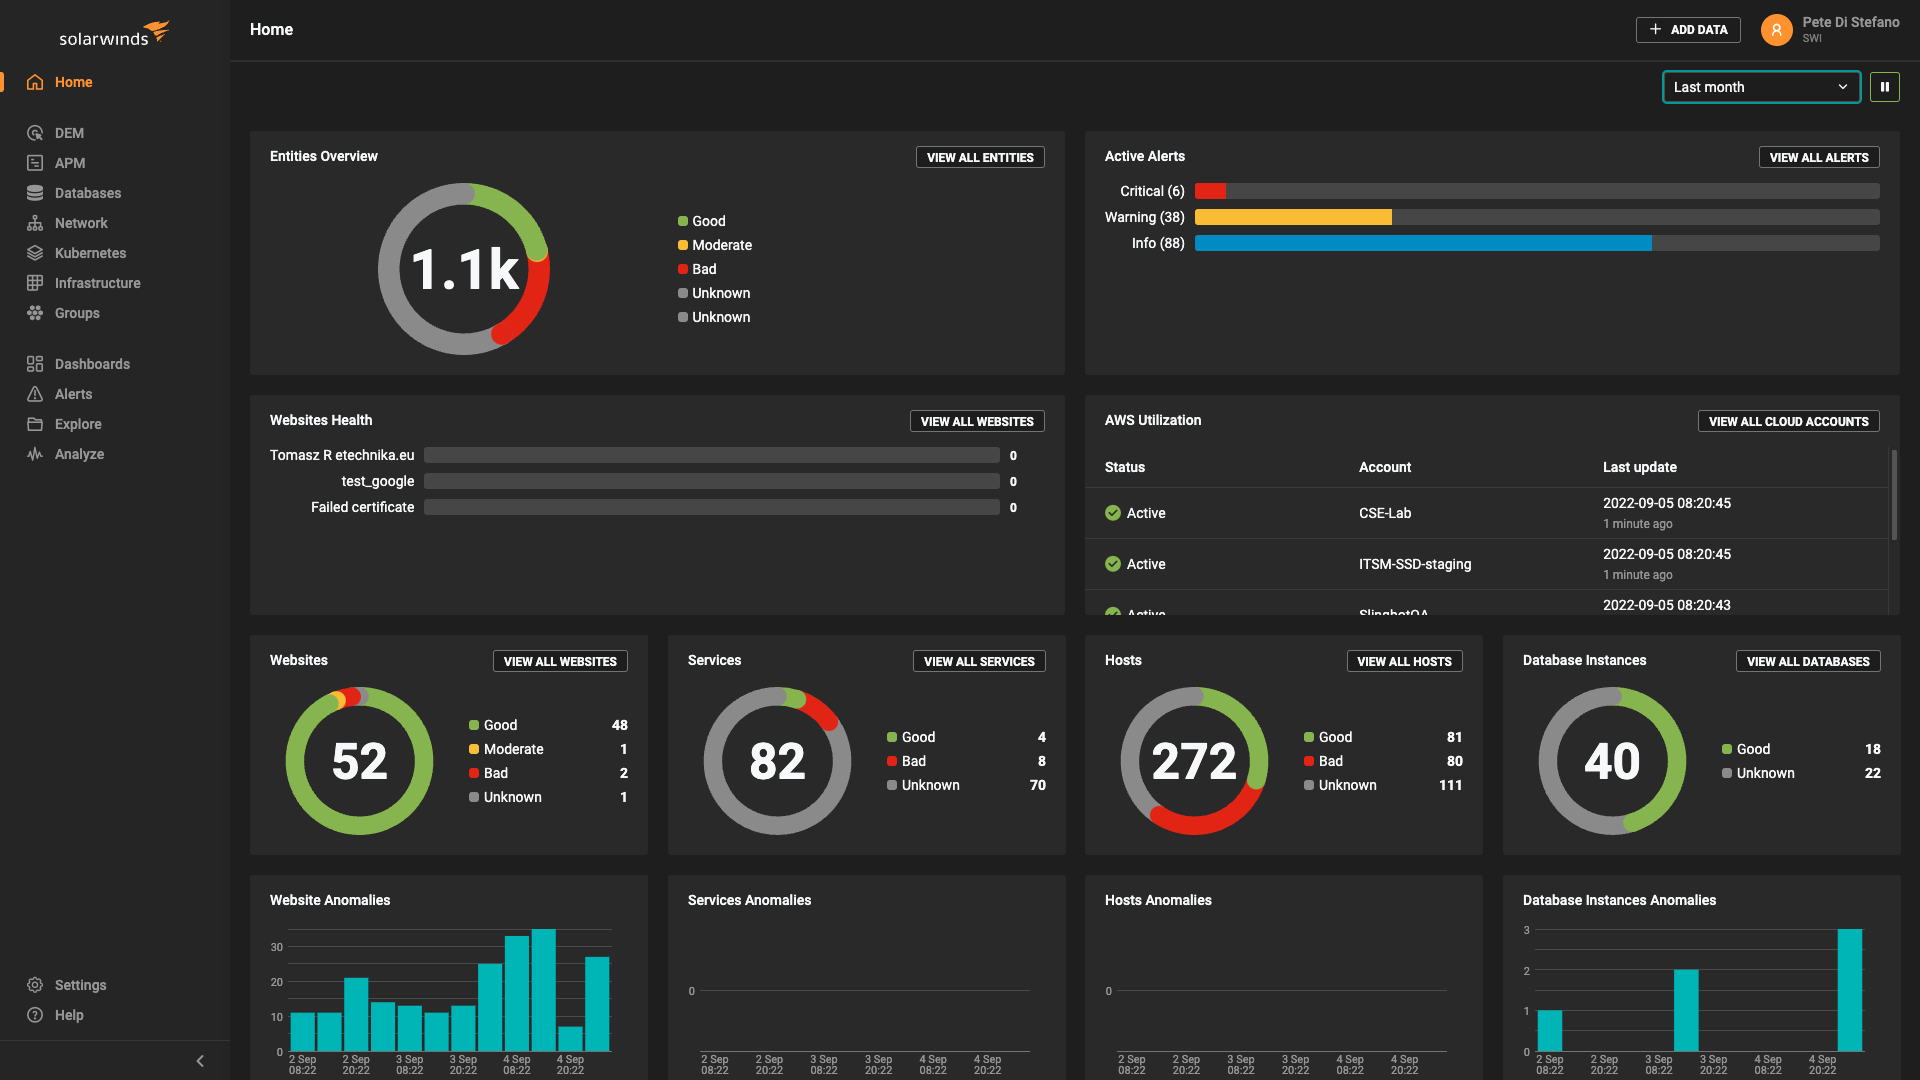
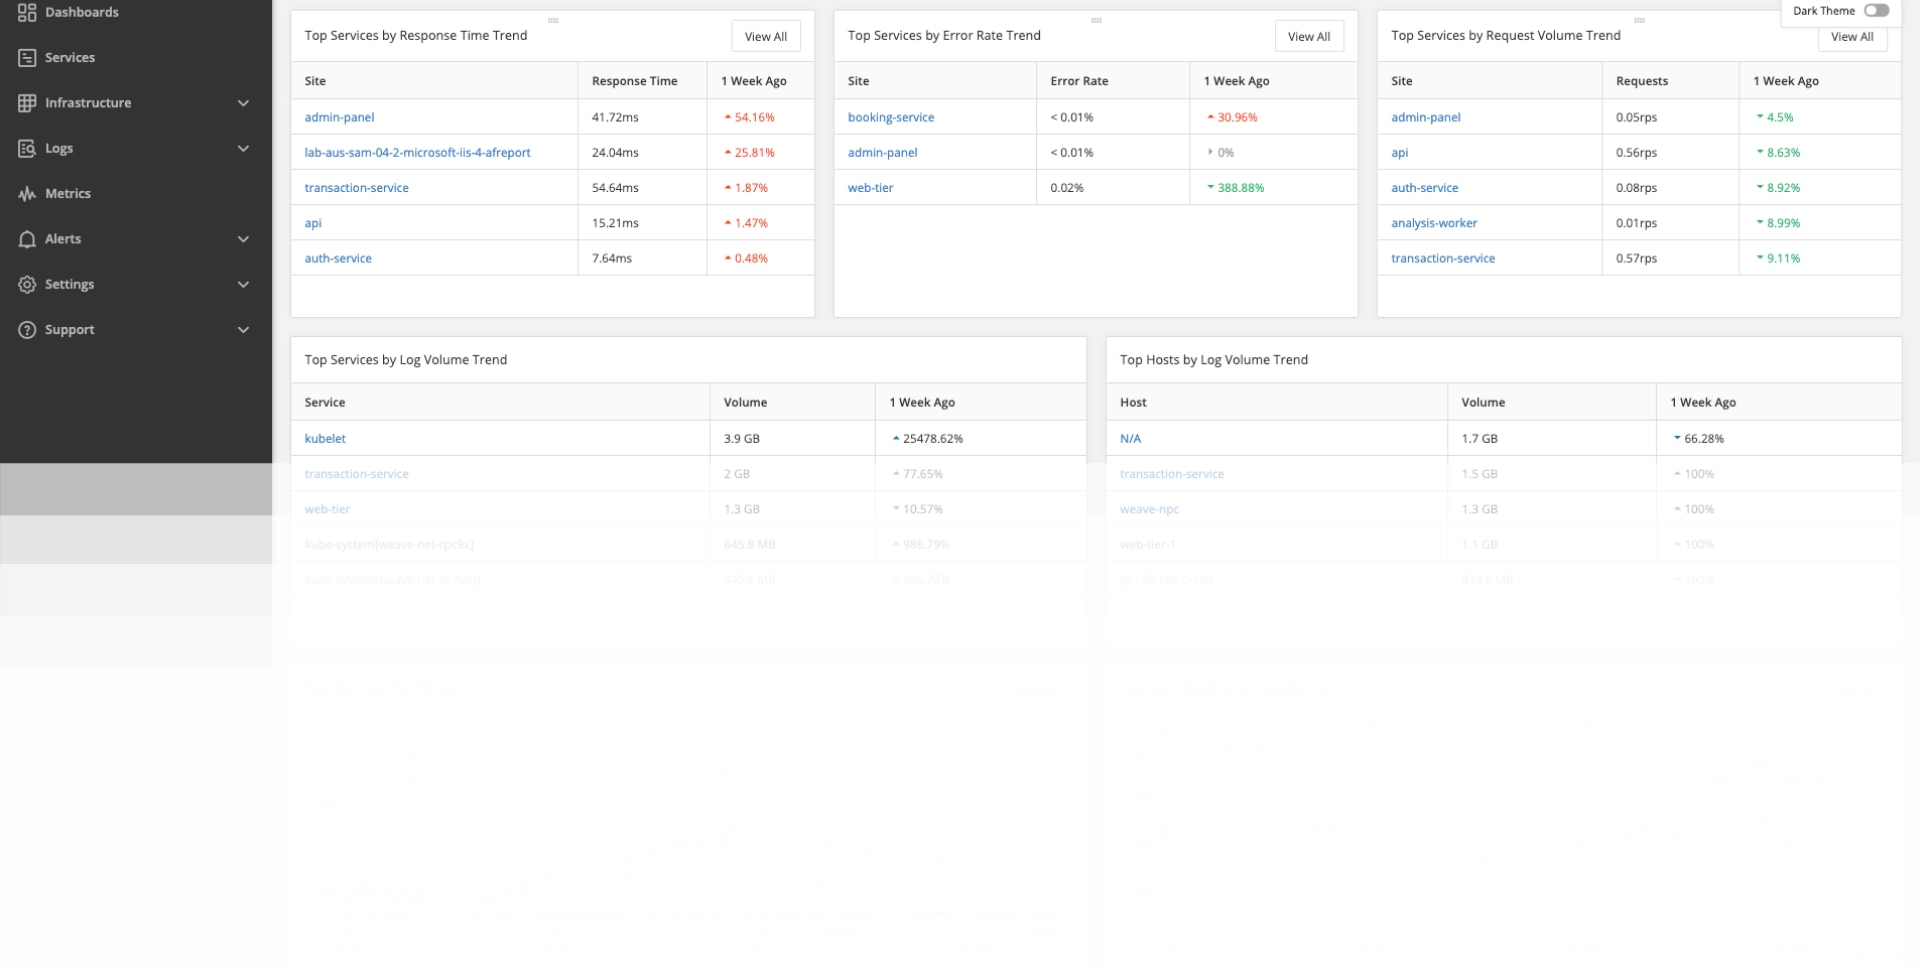
While APM tools define common visualizations that most companies will find useful, they cannot provide every view that will be valuable to you and your organization. As such, an APM tool needs to allow you to build robust custom dashboards. This means that the tool exposes all of the underlying metrics and has a robust set of graphing tools. Some metrics are better expressed as line graphs, others are bar or stacked bar charts, and some as pie charts or even simply green/red status indicators.
