Note: This article was originally published on Librato, which has since been merged with SolarWinds®AppOptics™. Explore what’s possible with AppOptics Docker performance monitoring.
Today, we’re honored to bring you a guest post by Treasure Data’s Kiyoto Tamura. Kiyoto is the developer evangelist at Treasure Data and one of the maintainers of Fluentd, the open-source data collector to simplify and scale log management. A math major and former quantitative analyst, he loves collecting and analyzing data. Today, Kiyoto will walk you through the creation of two Fluentd plugins that export per-container systems metrics from Docker to Librato. As a Fluentd maintainer, he makes it look easy; integrating Docker with Librato in under a hundred lines of code.
What is Docker?
Docker is a hugely popular open source container technology for Linux. Originally developed at the PaaS startup dotCloud, it’s been spreading like a wildfire. Heavyweight IaaS providers like Amazon, Google and IBM have all announced Docker support on their platform. RedHat is making Docker one of the highlights of the latest RHEL. It had its first user conference and released version one during the conference. Docker is probably the hottest open-source project of 2014.
As more and more people start using Docker, monitoring and instrumentation of containers become increasingly important, especially if you are running applications inside Docker in production. So, how would you do it?
Last October, Jerome Petazzoni wrote an informative blog article about Docker container metrics. Based on that, I decided to build a Docker metrics plugin for Fluentd.
What is Fluentd?
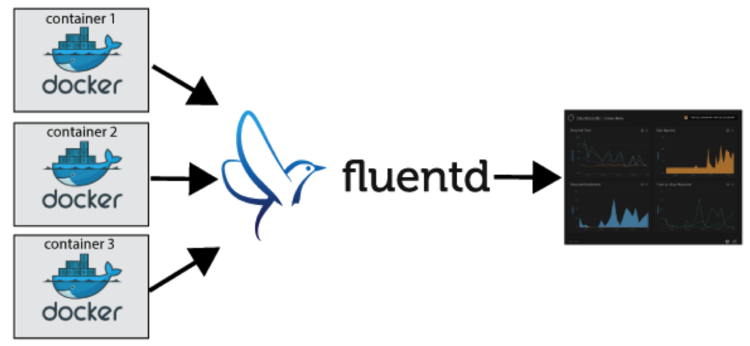
Fluentd is an open source data collector to simplify and scale log management. Common use cases include:
- Syslog aggregation into Elasticsearch
- Near real-time archiving of mobile or web application data into Amazon S3
- Data collection for Big Data backend systems like Hadoop
Fluentd supports a diverse assortment of use cases through its plugin architecture. By writing a bit of Ruby code (Fluentd is implemented in C and Ruby), one can add new data sources (inputs) and sinks (outputs). As of this writing, there are more than 300 user-contributed plugins.
For purposes of this article, I decided to go ahead and add two plugins to Fluentd’s ecosystem:
- The input plugin for Docker container metrics
- The output plugin for Librato

Input: Collecting Docker Container Statistics
Docker is built on top of cgroups, a kernel feature to limit, account, and isolate resource usage (CPU, memory, disk I/O, etc.) of process groups from the rest of the system. It records various per-container statistics under /sys/fs/cgroups. For example, if you are interested in the RSS (Resident Set Size) of the container “foobar”, it is in /sys/fs/cgroups/memory/docker/foobar/memory.stat. The format of these files are line-delimited key value pairs.
Based on this information, here is how I developed the “Docker metrics” input plugin for Fluentd.
- Write a parser method to parse different metrics. For memory and CPU usage, all the metrics can be found in memory.stat and cpuacct.stat respectively. One needs to be mindful that some metrics are gauges while others are counters. For Block IO, the necessary data is scattered across several files, so multiple files must be read. Again, Petazzoni’s blog article was hugely helpful.
- The parser from Step 1 needs to run inside Fluentd. Each Fluentd plugin has its own event loop, and a plugin author can register an arbitrary event. You can configure events to be run periodically. Here is the relevant part of the code from the Docker metrics plugin:
def start
     @loop = Coolio::Loop.new
     tw = TimerWatcher.new(@stats_interval, true, @log, &method(:get_metrics))
     tw.attach(@loop)
     @thread = Thread.new(&method(:run))
   end
   def run
     @loop.run
   rescue
     log.error "unexpected error", :error=>$!.to_s
     log.error_backtrace
   end
The “get_metrics” method does all the heavylifting of parsing various cgroups pseudofiles. Interested readers can check out the code here.
This is what the Docker events look like inside Fluentd:
2014-06-12 02:33:04 +0000 docker.cpuacct.stat: {"key":"cpuacct_stat_user","value":51,"source":"docker:precise64:e5a4f22aeedb3fe293b9ea68b7062ec5e086975ed62fe423c74693bc06877039"}
Each line is a separate event corresponding to a different container metric. For example, the first line shows that the CPU usage for the container ID = “e5a4f22…” on host “precise64”.
Output: Librato Metrics
Now, let’s send the collected metrics to Librato. In the Fluentd world, this amounts to writing an output plugin. The workflow of writing an output plugin is as follows:
- Implement the initialize/configure methods: these methods allow the plugin authors to introduce plugin-specific parameters like API keys, REST API endpoints, timeout parameters and so forth.
- Implement the “write” method. This is the method that writes out Fluentd events to the destination system. In the present example, this is where we POST data to Librato.
Thanks to Librato’s well-documented Ruby client library, this was a breeze. Here is the relevant code snippet:
def configure(conf)
      super
      require 'librato/metrics'
      Librato::Metrics.authenticate @email, @apikey
      @queue = Librato::Metrics::Queue.new
    end

    def write(chunk)
      chunk.msgpack_each { |tag, time, record|
        missing_keys = [@measurement_key, @value_key, @source_key].select { |k| !record[k] }
        if missing_keys.length > 0
          log.warn "missing the required field(s) " + missing_keys.join(",")
          next
        end
        @queue.add(
          record[@measurement_key].to_s =>
            {
              :source => record[@source_key],
              :value => record[@value_key],
              :type => record[@type_key] || "gauge"
            })
      }

      @queue.submit
    end
The @queue is a Librato queue which holds individual events. Unless noted otherwise, the metric is defaulted to a gauge (as opposed to a counter). Then, the queued events are sent to Librato over HTTP. What if the connection between Fluentd and Librato fails? No worries. Fluentd buffers the data (either in memory but also on disk) and tries again later.
Configuring Fluentd
Fluentd can be installed either as a Gem or Linux/OSX packages (as td-agent). It has a declarative configuration DSL to route messages. For example, here is the one I used to collect data Docker container metrics into Librato (using my two plugins):
<source>
  type docker_metrics
  stats_interval 1m
</source>
<match docker.**>
    type librato
    email LIBRATO_EMAIL
    apikey LIBRATO_APIKEY
</match>


Graphs!
The best part of Librato? You do not have to set up your own backend or know anything about charting libraries to get the results. It literally took me five minutes to set up these graphs:
Each graph shows a different metric across containers, allowing the user to see which container is consuming a lot of CPU/Memory/Disk IO.
Next Steps
Admittedly, that was a lot of stuff to cover in a single guest blog post, so here are some links to learn more about Docker and Fluentd.
- The Docker website is a great place to learn what Docker is. I am especially a fan of their in-browser emulator
- The Fluentd website has a great deal of information on its architecture and use cases. If you are a Ruby hacker and curious how things work underneath, check out the source code on GitHub (the core is pretty small: it’s ~5000 lines of Ruby).
As mentioned in Librato’s Collector Patterns post, Fluentd is a fantastic general purpose event processor for log data that, as we’ve seen above, easily extends to other sources of metrics data. Being free, stable, high-performance, flexible and well supported, it’s an excellent choice for your metrics collection endeavors. If you haven’t played with it, you’re missing out.