


SolarWinds® AppOptics™ was designed from the ground up as a SaaS-based APM tool for cloud-native and traditional IT implementations. It provides out-of-the-box monitoring for applications and infrastructure through simple-to-install APM libraries and host agents. AppOptics makes it easy for multiple teams to quickly assess the health and performance of your applications regardless of how or where they are implemented. AppOptics was built on a decade of experience with advanced APM capabilities like distributed transaction tracing, custom metrics that allow you to bring in business metrics, and just about any other metric to be viewed and alerted on, side by side with your infrastructure and application metrics. AppOptics also has comprehensive integrations for both cloud platforms including dozens of AWS and Microsoft Azure services.
For most users, the visibility provided out of the box is sufficient, and we provide the ability to enhance APM coverage through our instrumentation SDKs. Today we’re announcing the ability to enhance infrastructure monitoring through open-source libraries and the ability to create custom plugins for the Snap framework.
The SolarWinds Snap framework consists of an agent and a set of plugins controlled by the agent. Each plugin may be enabled and configured based on what the user wants to observe. For example, there are plugins responsible for gathering system metrics, docker metrics and events, and mongoDB counters. Several plugins offer integrations with other services from SolarWinds, like Papertrail™ and Loggly®.
If you want to monitor an application for which a corresponding plugin doesn’t exist, you can now write your custom plugins. The SolarWinds Snap framework now provides a special library to make custom plugin development easier (https://github.com/solarwinds/snap-plugin-lib/tree/master/v2/). The repository contains an extensive tutorial covering the majority of capabilities provided by the library.
This article will guide you through:
- Writing a custom plugin providing user-defined metric(s)
- Integrating AppOptics with custom plugin metrics
- Making custom plugins configurable
Getting Started With Custom Plugins
As an intro to writing custom snap plugins, we’ll create a simple plugin to measure ping response times to specific domains. The first version will be very simple (even the target address will be defined in the code). In the last section, we’ll improve the plugin, making it fully configurable (using task files).
Ping Collector (v0.0.1)
Basic plugin code which allows to build the simplest executable plugin may be written as follows (https://github.com/solarwinds/snap-plugin-collector-ping/tree/v0.0.1)
package main

import (
    "context"

    "github.com/solarwinds/snap-plugin-lib/v2/plugin"
    "github.com/solarwinds/snap-plugin-lib/v2/runner"
)

const (
    pluginName    = "ping"
    pluginVersion = "0.0.1"
)

type pingCollector struct {
}

func (c *pingCollector) Collect(ctx plugin.CollectContext) error {
    return nil
}

func main() {
    runner.StartCollectorWithContext(context.Background(), &pingCollector{},
	pluginName, pluginVersion)
}
Because the plugin is very simple, the entire code can be held in a one file, so our module name is “main.. In the “import” section we list dependencies needed for compilation. Then some constants are defined: one related to plugin name and one to plugin version. Both values are used in the “main” function when “runner.StartCollectorWithContext” is called.
The essential part of the plugin definition is the “pingCollector” structure, which implements the “plugin.Collector” interface. “Collect” method will be called by the Swisnap framework every 1 minute (by default).
This code is already compilable. To build it, we need to download dependencies. The simplest way is to call:
go mod init
go mod tidy
go mod vendor
When dependencies are downloaded, we can build the solution:
go buildand run it:
./snap-plugin-collector-ping.exeThe output should be similar to the one given below, and the plugin should exit after ~20s.
{"Meta":{"RPCVersion":"2.0.0"},"Plugin":{"Name":"ping","Version":"0.0.1","Type":0},"GRPC":{"IP":"127.0.0.1","Port":53116,"TLSEnabled":false},"Constraints":{"InstancesLimit":0,"TasksLimit":0},"Profiling":{"Enabled":false,"Location":""},"Stats":{"Enabled":false,"IP":"","Port":0}}
time="2020-10-08T17:53:56+02:00" level=warning msg="Ping timeout occurred" layer=lib max=3 missed=1 module=plugin-rpc service=Control
time="2020-10-08T17:54:02+02:00" level=warning msg="Ping timeout occurred" layer=lib max=3 missed=2 module=plugin-rpc service=Control
time="2020-10-08T17:54:08+02:00" level=warning msg="Ping timeout occurred" layer=lib max=3 missed=3 module=plugin-rpc service=Control
time="2020-10-08T17:54:08+02:00" level=error msg="Major error occurred - plugin will be shut down" error="ping message missed 3 times (timeout: 6s)" layer=lib module=plugin-rpc
Ping Collector (v0.0.2)
The version we’ve just written is just a skeleton of the real plugin and doesn’t gather any information. The new code we’re going to write will change that.
To obtain ping duration for a given address, we’ll use the “github.com/adamiklukasz/go-ping” library. Also, we’ll increase the current version of the plugin and introduce a constant for target address (as already mentioned, we’ll make it configurable later). So, the first half of the code looks like:
package main

import (
    "context"

    "github.com/adamiklukasz/go-ping"
    "github.com/solarwinds/snap-plugin-lib/v2/plugin"
    "github.com/solarwinds/snap-plugin-lib/v2/runner"
)

const (
    pluginName    = "ping"
    pluginVersion = "0.0.2"

    targetAddr = "www.solarwinds.com"
)
The plugin code will be modified as follows:
type pingCollector struct {
}

func (c *pingCollector) Collect(ctx plugin.CollectContext) error {
    dur, err := ping.Ping(targetAddr)
    if err != nil {
        return err
    }

    durMs := int(float64(dur) / 1000000)

    ctx.AddMetric("/solarwinds/ping/time", durMs, plugin.MetricTag("target", targetAddr), plugin.MetricUnit("ms"))

    return nil
}
In the method “Collect,” we’re now performing a set of actions. First, using the “go-ping” library, we gather ping response duration for “www.solarwinds.com.” In case of error, “Collect” method will exit. Ping returns duration as “time.Duration” type, which is an int representing time in nano-seconds. Since usually ping responses are given in milliseconds, we need to scale it (“durMs”). Next, we create a metric “/solarwinds/ping/time” with prescaled value and decorated with tag (target address) and unit. Tags and units are additional data we can later use to enhance and control metric’s graphs in AppOptics.
Of course, we need to provide the main function as well.
func main() {
    runner.StartCollectorWithContext(context.Background(), &pingCollector{},
	 pluginName, pluginVersion)
}
We can confirm our plugin is working correctly by building it and executing it directly in debug-mode.
./snap-plugin-collector-ping.exe --debug-mode --debug-collect-counts=3Example output:
Gathered metrics (length=1):
/solarwinds/ping/time 17 {map[target:www.solarwinds.com]}

Gathered metrics (length=1):
/solarwinds/ping/time 18 {map[target:www.solarwinds.com]}

Gathered metrics (length=1):
/solarwinds/ping/time 21 {map[target:www.solarwinds.com]}
Integrating AppOptics With Custom Plugin Metrics
Now it’s time to configure SolarWinds Snap to run the ping plugin automatically. To do so, we need to perform the following steps:
- Stop swisnapd service:
- Windows: “net stop swisnapd”
- Linux: “sudo swisnapd stop”
- Copy binary to “bin” folder
- Windows: “c:\Program Files\SolarWinds\Snap\bin\”
- Linux: “/opt/SolarWinds/Snap/bin”
- Create task “task_ping.yaml” which utilizes our custom plugin binary
- Windows: “c:\ProgramData\SolarWinds\Snap\tasks-autoload.d\”
- Linux: “/opt/SolarWinds/Snap/etc/tasks-autoload.d”
- Uncomment line “plugin_trust_level: 1” and change the it to “plugin_trust_level: 0” in config.yaml (allow to execute not-signed plugins)
- Windows: “c:\ProgramData\SolarWinds\Snap\config.yaml”
- Linux: “/opt/SolarWinds/Snap/etc/config.yaml”
- Start swisnapd service
- Windows: “net start swisnapd”
- Linux: “sudo swisnapd start”
Task created in step three should have the following content:
version: 2

schedule:
  type: cron
  interval: "0 * * * * *"

plugins:
  - plugin_name: ping
    publish:
      - plugin_name: publisher-appoptics
You can validate the plugin and task were correctly loaded and it’s running by executing following commands (requires administrator/root privileges). You should find entries with ping collector:
swisnap plugin list
swisnap task list
When the plugin sends its metrics to AppOptics for the first time, it’s shown in the integrations tab and disabled by default. To enable it, look for the “plugins” panel and click “ping.” Then, in the new window click “Select all metrics” and “Enable Plugin” on the bottom of the new window.
Now you can observe the metric from AppOptics. You can open the “Metrics” page and search for “ping” related metrics and see the measurement of it in a defined time period (i.e., last 15 minutes).
Now that you have metrics flowing into AppOptics, you can use them in custom dashboards:
- Open “Dashboard” page
- Click “Create a New Dashboard”
- Click on the big blue plus, select “Line”
- Search for metrics containing “ping,” select them, and click “Add Metrics to Chart”
- Click “Done Adding Metrics”
- Click “Save”
- Resize the widget by dragging the right-bottom corner
Making Your Custom Plugin Configurable
v0.1.0
Even though our custom plugin is quite functional, it has no configuration options. If we’d like to ping different targets or trace pings for several addresses, we need to change the code and compile into several, separated binaries.
There’s a better approach. We can make the plugin configurable and provide a list of target addresses from task file(s). There are also other factors we may want to configure: the number of ping requests and the interval between them. Instead of having only one metric, we’ll introduce four new: average, min, max value of ping request duration, and service availability.
Let’s start coding.
First, we’ll define a new list of constants. You may notice “pluginVersion” is changed and a new constant, “configKey,” is introduced. It will be used to store/load our configuration sent from a task file.
const (
	pluginName    = "ping"
	pluginVersion = "0.1.0"

	configKey = "config"
)
Next, let’s define a configuration structure for our plugin:
type config struct {
	TargetAddresses []string `json:"target_addresses"`
	Requests        int      `json:"requests"`
	IntervalSec     int      `json:"interval_sec"`
}
As we mentioned, there are three configuration options: list of addresses to ping, number of requests sent to each address, and interval (in seconds) between consecutive ping requests.
With this configuration, we can define our tasks as follows:
---
version: 2

schedule:
  type: cron
  interval: "0 * * * * *"

plugins:
  - plugin_name: ping
    config:
      target_addresses:
        - www.appoptics.com
        - www.loggly.com
        - www.pingdom.com
      interval_sec: 5
      requests: 3
    tags:
      category: SaaS applications
    publish:
      - plugin_name: publisher-appoptics
In our first version, the plugin had only the necessary “Collect” method implemented. The SolarWinds Snap framework allows us to use other methods, especially “PluginDefinition” and “Load.” The first one provides metadata information for the plugin, and “load” defines actions taken during a new task startup.
Let’s implement “PluginDefinition” first. Here we define metrics the plugin can extract. Since we defined the unit and description of metrics, we don’t need to provide them later, when “AddMetric” is called.
func (*pingCollector) PluginDefinition(def plugin.CollectorDefinition) error {
	def.DefineMetric("/solarwinds/ping/avg_time", "ms", true, "Average duration of ping requests")
	def.DefineMetric("/solarwinds/ping/min_time", "ms", true, "Minimum duration of ping requests")
	def.DefineMetric("/solarwinds/ping/max_time", "ms", true, "Maximum duration of ping requests")
	def.DefineMetric("/solarwinds/ping/availability", "", true, "Target address is available via ping [0-no, 1-yes]")

	return nil
}
“Load” method is defined below. It obtains configuration provided to the task (as bytes) and tries to unmarshal it (convert from JSON format to Go structure). On a success, it stores the configuration structure in context (object associated with current task). You can’t store configuration in struct “pingCollector” because you’ll overwrite it when using more than one task.
func (*pingCollector) Load(ctx plugin.Context) error {
	var cfg config
	b := ctx.RawConfig()

	err := json.Unmarshal(b, &cfg)
	if err != nil {
		return err
	}

	ctx.Store(configKey, cfg)

	return nil
}
At the end, let’s reimplement the “Collect” method.
func toMs(d time.Duration) int {
	return int(float64(d) / 1000000)
}

func (*pingCollector) Collect(ctx plugin.CollectContext) error {
	var cfg config
	wg := sync.WaitGroup{}

	err := ctx.LoadTo(configKey, &cfg)
	if err != nil {
		return err
	}

	for _, targetAddr := range cfg.TargetAddresses {
		wg.Add(1)

		go func(targetAddr string) {
			defer wg.Done()

			pingOk := 1
			tags := plugin.MetricTag("target", targetAddr)

			stat, err := ping.PingN(targetAddr, cfg.Requests, time.Second*time.Duration(cfg.IntervalSec))
			if err != nil {
				pingOk = 0
			} else {
				_ = ctx.AddMetric("/solarwinds/ping/avg_time", toMs(stat.Avg), tags)
				_ = ctx.AddMetric("/solarwinds/ping/min_time", toMs(stat.Min), tags)
				_ = ctx.AddMetric("/solarwinds/ping/max_time", toMs(stat.Max), tags)
			}

			_ = ctx.AddMetric("/solarwinds/ping/availability", pingOk, tags)
		}(targetAddr)
	}

	wg.Wait()
	return nil
}
First, we define a helper function (“toMs”) which converts ping duration (time.Duration) to milliseconds (int). Then, we move to the “Collect” function. At the beginning, we load configuration (saved in “Load” method). Next, the most important step is iterating over target addresses (obtained from configuration).
In each iteration, we handle a single address, but we schedule the goroutine to speed up measurements (ping requests for different addresses can be done simultaneously). In the goroutine, we call PingN, which returns statistics (min, max, and average duration) for a given address and potential error (if address can’t be reached). Based on those values, metrics are filled in and added.
As before, we must provide the “main” function:
func main() {
	runner.StartCollectorWithContext(context.Background(), &pingCollector{}, pluginName, pluginVersion)
}
The completed code is also available on https://github.com/solarwinds/snap-plugin-collector-ping/tree/v0.1.0.
Updating Binary and Tasks
At this point, we can compile our plugin and copy it to the bin folder. We’ll use two task files, which we should copy to the “tasks-autoload.d” folder. Please refer to “Integrating AppOptics with custom plugin metrics” for necessary steps.
Task files content:
---
version: 2

schedule:
  type: cron
  interval: "0 * * * * *"

plugins:
  - plugin_name: ping
    config:
      target_addresses:
        - www.appoptics.com
        - www.loggly.com
        - www.pingdom.com
      interval_sec: 5
      requests: 3
    tags:
      category: SaaS applications
    publish:
      - plugin_name: publisher-appoptics


---
version: 2

schedule:
  type: cron
  interval: "0 * * * * *"

plugins:
  - plugin_name: ping
    config:
      target_addresses:
        - www.solarwinds.com
      interval_sec: 3
      requests: 3
    tags:
      category: private
    publish:
      - plugin_name: publisher-appoptics
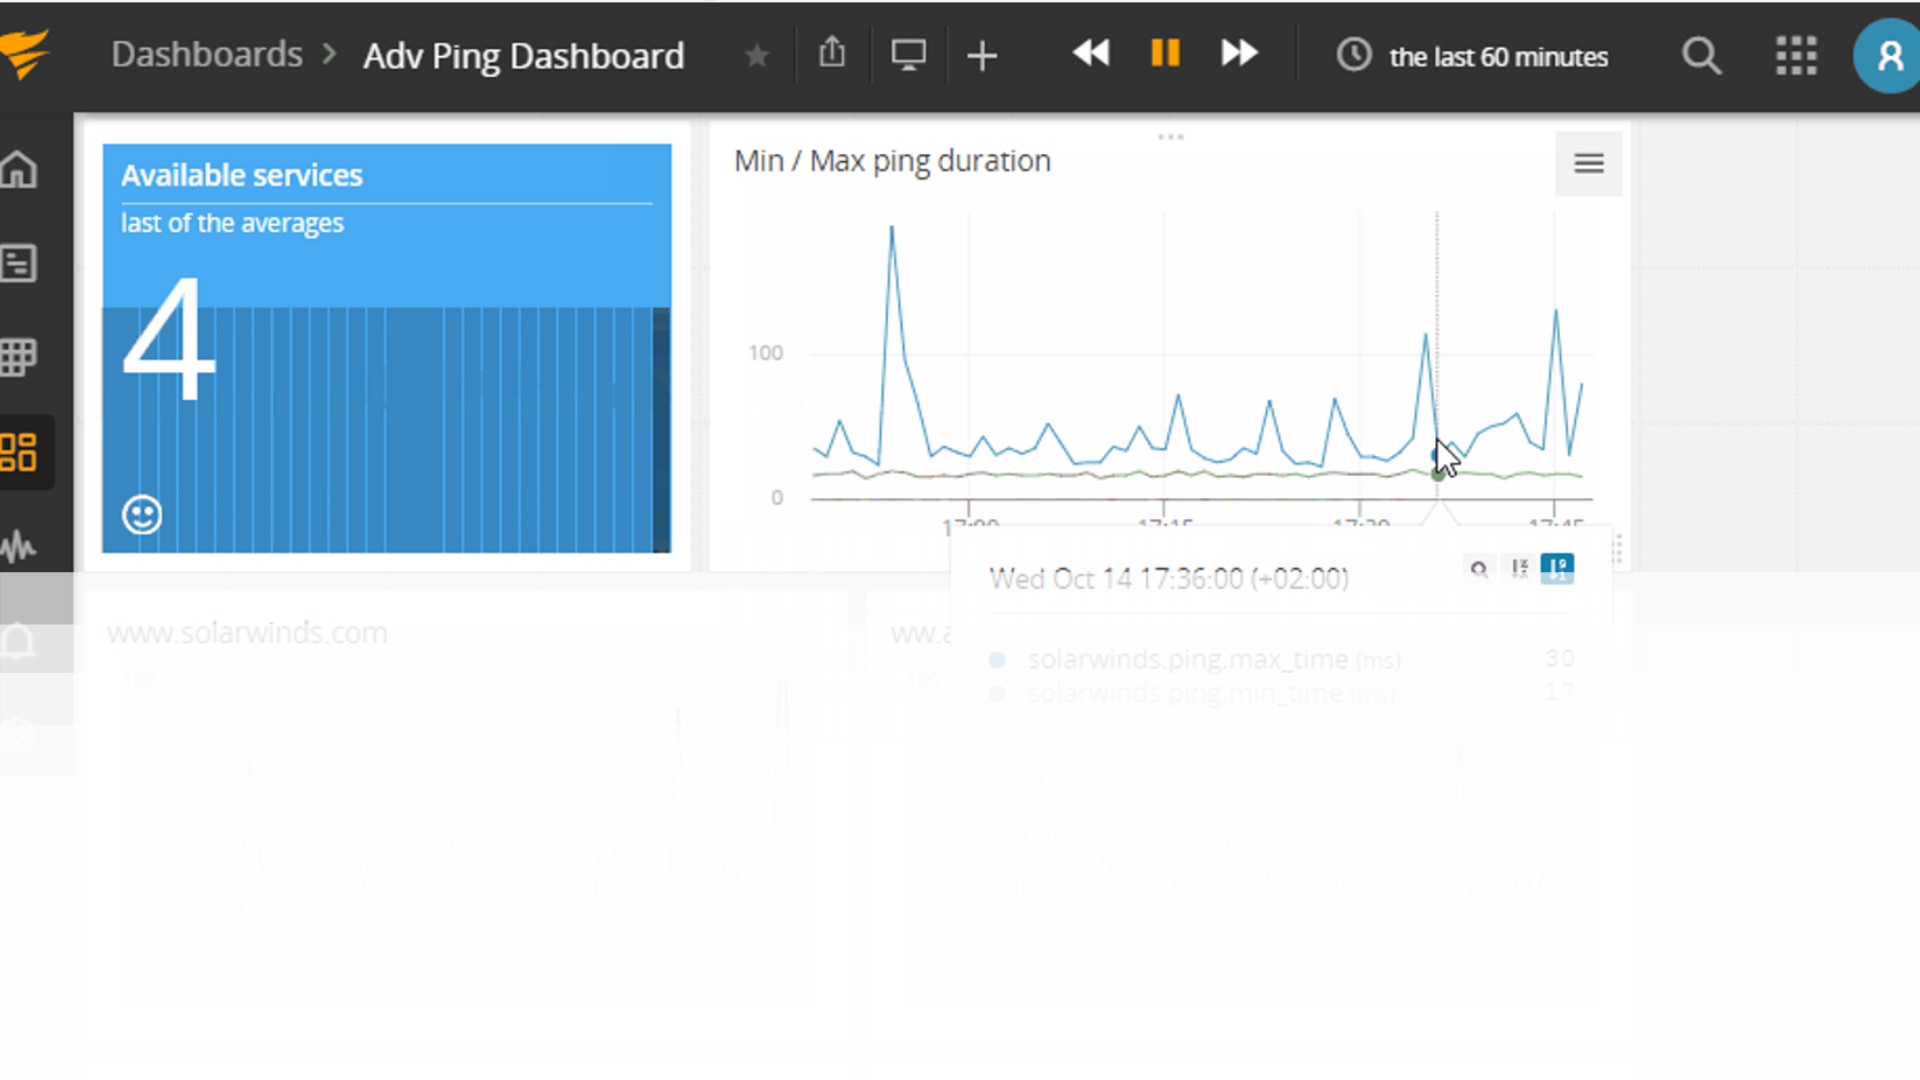
Final Result
After restarting swisnapd, metrics should be available in AppOptics. Based on those new metrics, we can create more advanced dashboards and graphs.
Monitoring your system using AppOptics and the SolarWinds Snap framework is easy. Installation is simple, and basic configuration doesn’t require advanced skills. Moreover, the SolarWinds Snap plugin library enables monitoring with little effort put on coding. Along with APM (application performance monitoring), alarms, and integrated logging, you have even more control over your system state.
See More
- Library public repository: https://github.com/solarwinds/snap-plugin-lib
- Tutorial: https://github.com/solarwinds/snap-plugin-lib/tree/master/v2
- List of supported platforms: https://documentation.solarwinds.com/en/Success_Center/appoptics/Content/kb/host_infrastructure/host_agent.htm
- Signing custom plugins: https://documentation.solarwinds.com/en/Success_Center/appoptics/Content/kb/host_infrastructure/host_agent/swisnap/plugin_trust.htm
- Task file structure: https://documentation.solarwinds.com/en/Success_Center/appoptics/Content/kb/host_infrastructure/host_agent/swisnap/task_file.htm
If you haven’t experienced the simple-to-install and easy-to-use SolarWinds AppOptics, maybe now is the time. Explore its comprehensive infrastructure server and virtual host—alongside auto-instrumented root cause, detailed service and transaction traces, and insights down to the line of poor performing code. Sign up for a 30-day free trial.


