Every day more and more third-party service providers are publishing APIs for their customers to consume, with many of them competing against each other. For instance, with payment APIs, you can use Stripe, Recurly, Chargify, or several others.
Criteria for Choosing a Third-Party API
There are many criteria to help you choose the correct service for your product. Below are some examples.
- Documentation – Is the service fully documented? Can you easily find answers to your questions? Are there numerous examples and are those examples in your target language (both programming and spoken language)?
- Language support– Is there a wrapper or SDK for your language? How easy will it be to create calls to their service? Are there code examples?
- Features – Does the service have all the features you need? Knowing which features are required can help you filter out unsuitable options.
- Support – Is there someone available to answer your questions when there are issues? There are sometimes issues only the service provider can help you with.
- Familiarity – Have you used the product successfully in the past? Was it easy to integrate with your former project?
Most of those criteria (we’ll call exploratory criteria) can be answered by a surface scanning of their documentation and marketing sites. Before committing financially to a company, you may want to know how it performs under real load. Is the service highly available? Is the performance better or on-par with similar service providers?
You may already be using a service provider, but aren’t sold on the performance, availability, or error count you encounter from the current service provider. You realize things could be worse, but it would be nice to benchmark the two against each other before making the switch.
To help with some additional criteria, you can use a tool like SolarWinds® AppOptics™ to help you gather information and see if the third-party meets the criteria.
- Performance – How long does each third-party service take to respond? This might be the most important of all criteria. We can gather this information from AppOptics auto-instrumentation.
- Reliability – How often are there unexpected errors? How often do you need to retry requests? Does this cause interruption for your customers? We can track this by using the AppOptics SDK to designate transaction names.
- Resource size – REST APIs may be sending you more information than you need. AWS and other providers charge money based on network activity, so if there will be large amounts of packets exchanged, even small differences could wind up costing more than you’re comfortable with. We can track this using AppOptics custom metrics.
Using an APM Tool to Collect Third-Party Performance Criteria
Some of the previously stated criteria (we’ll call them performance criteria) will be collected automatically by AppOptics, where others will require taking advantage of the SDK to add custom information. I’m going to use a Rails example, but the basic idea can be implemented in any of our supported programming languages.
We can start with GET calls. Let’s say we want to add translation functionality to our application. Using the exploratory criteria, we’ve narrowed the list to two services, Service A and Service B (naming is hard).
Note: From this point on, I’ll assume you ‘ve gone through the AppOptics installation process, and traces have successfully been transmitted. It’s a two-step install and should take no longer than five minutes to start seeing traces from your application. You can start a two-week trial or sign up for the free AppOptics Dev Edition.
I’ll start with a sample controller for translating text and add a random choice to call Service A or Service B and return the response as JSON data.
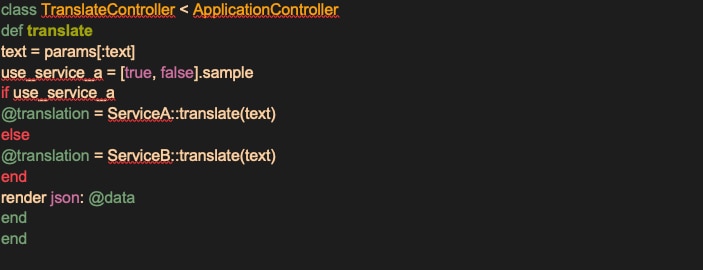
Each service will be instrumented automagically by AppOptics and the response time will be broken down in detail in the Service > Remote Services section of the UI.
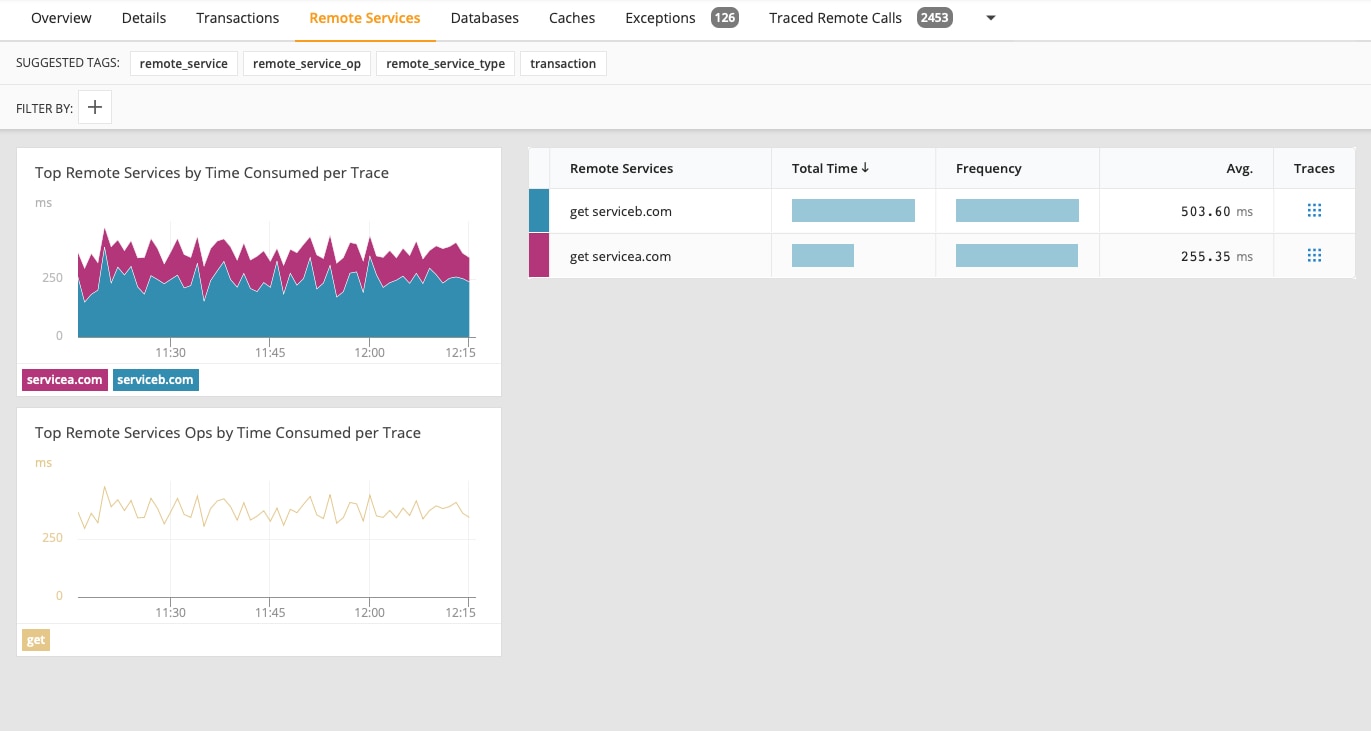
Here you can see Service B is taking about twice as long as Service A on average.
On to reliability. AppOptics does a great job of capturing errors and exceptions but in this case, we need a way to distinguish the metrics when the different remote services are used. We can use the SDK to change the name of the transaction to gain insight into the reliability of each remote service. We can set transaction names and change the if block in our code.

Now all the errors/exceptions can be filtered by transaction and we can compare them to see which service is more reliable and stable. This also gives us a chance to review if we’re sending the requests improperly.

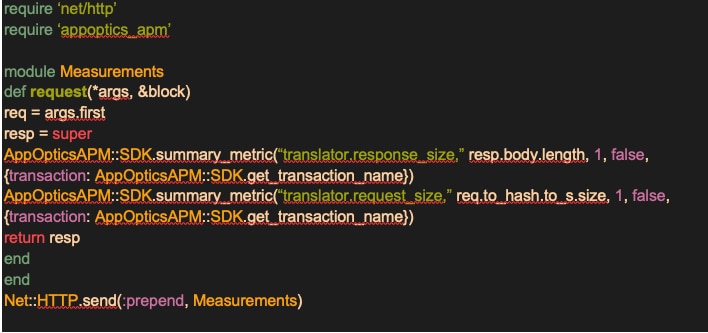
To monitor resource size, we need to get creative and use a bit of ruby magic to track the information we need. We’re going to prepend a method to the Net::HTTP request method to gather metrics for each of the services.
We can add the following code file where the controller lives. By default, the only tag sent with the measurement is the ‘service‘ tag (which is the name of the AppOptics Service), but since we set the transaction name, we can add the ‘transaction‘ tag to separate out the different services. Also, using the ‘transaction‘ tag helps keep the tags in sync with the other metrics.
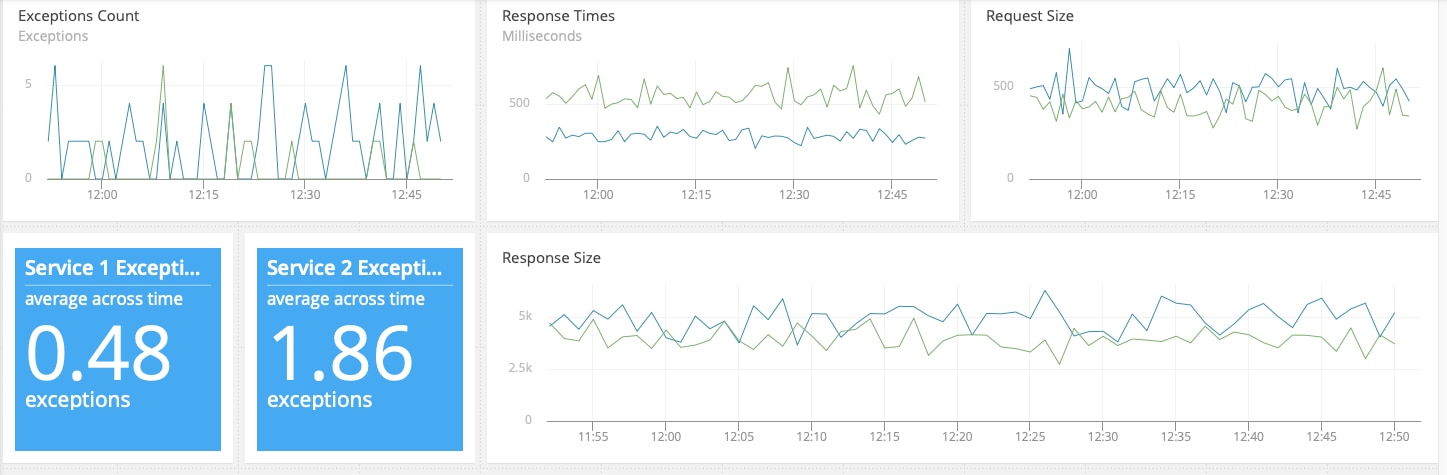
Now we’re able to plot the response and request size to compare the two. You can see Service A is about 20% higher for response size.

Decision Time
How the criteria will affect your decision is subjective. For instance, if you only use these services once during a user signup process, the impact of the request and response size is likely to be minimal.
I pulled all the information together into one dashboard so everything could be seen together. I have the yaml configuration file for the below dashboard if you want to import it into your account. The file has curly braces around the values which you’ll need to change to fit your situation.
This gives you a quick sample on how you can compare service performance criteria using AppOptics but there’s much more to explore. For instance, this works well for read-only services, but what about more complex API usage for services storing application state like a database or authentication service? Also, I’d advise testing in a staging or test environment before moving the code to production.
Summary
More and more applications rely on one or more third-party APIs, so it’s worth the time to define a set of performance criteria when evaluating which are the best one(s) for your application. To see how each API’s performance stack up to your criteria, you’ll want to use an APM tool like AppOptics.
If you have any questions on how to use AppOptics for benchmarking third-party services, feel free to contact me at mbeale@SolarWinds.cloud.
If you haven’t experienced the simple-to-install and easy-to-use AppOptics, maybe now is the time. Explore its comprehensive infrastructure server, virtual host, and —alongside auto-instrumented root cause, detailed service and transaction traces, and insights down to the line of poor performing code. Signup for a 30-day free trial.