The world of IT is full of confusing terms. In this post, we’ll explain everything you need to know about application performance monitoring and real user monitoring.
First, let’s start with the definition of both:
Application performance monitoring, or APM for short, is a collection of technologies measuring the performance of an application, from the underlying infrastructure, to the services making up the application, down to the code level.
Real user monitoring, or RUM, is the act of monitoring the actual user’s experience while using the web application.
Application Performance Monitoring
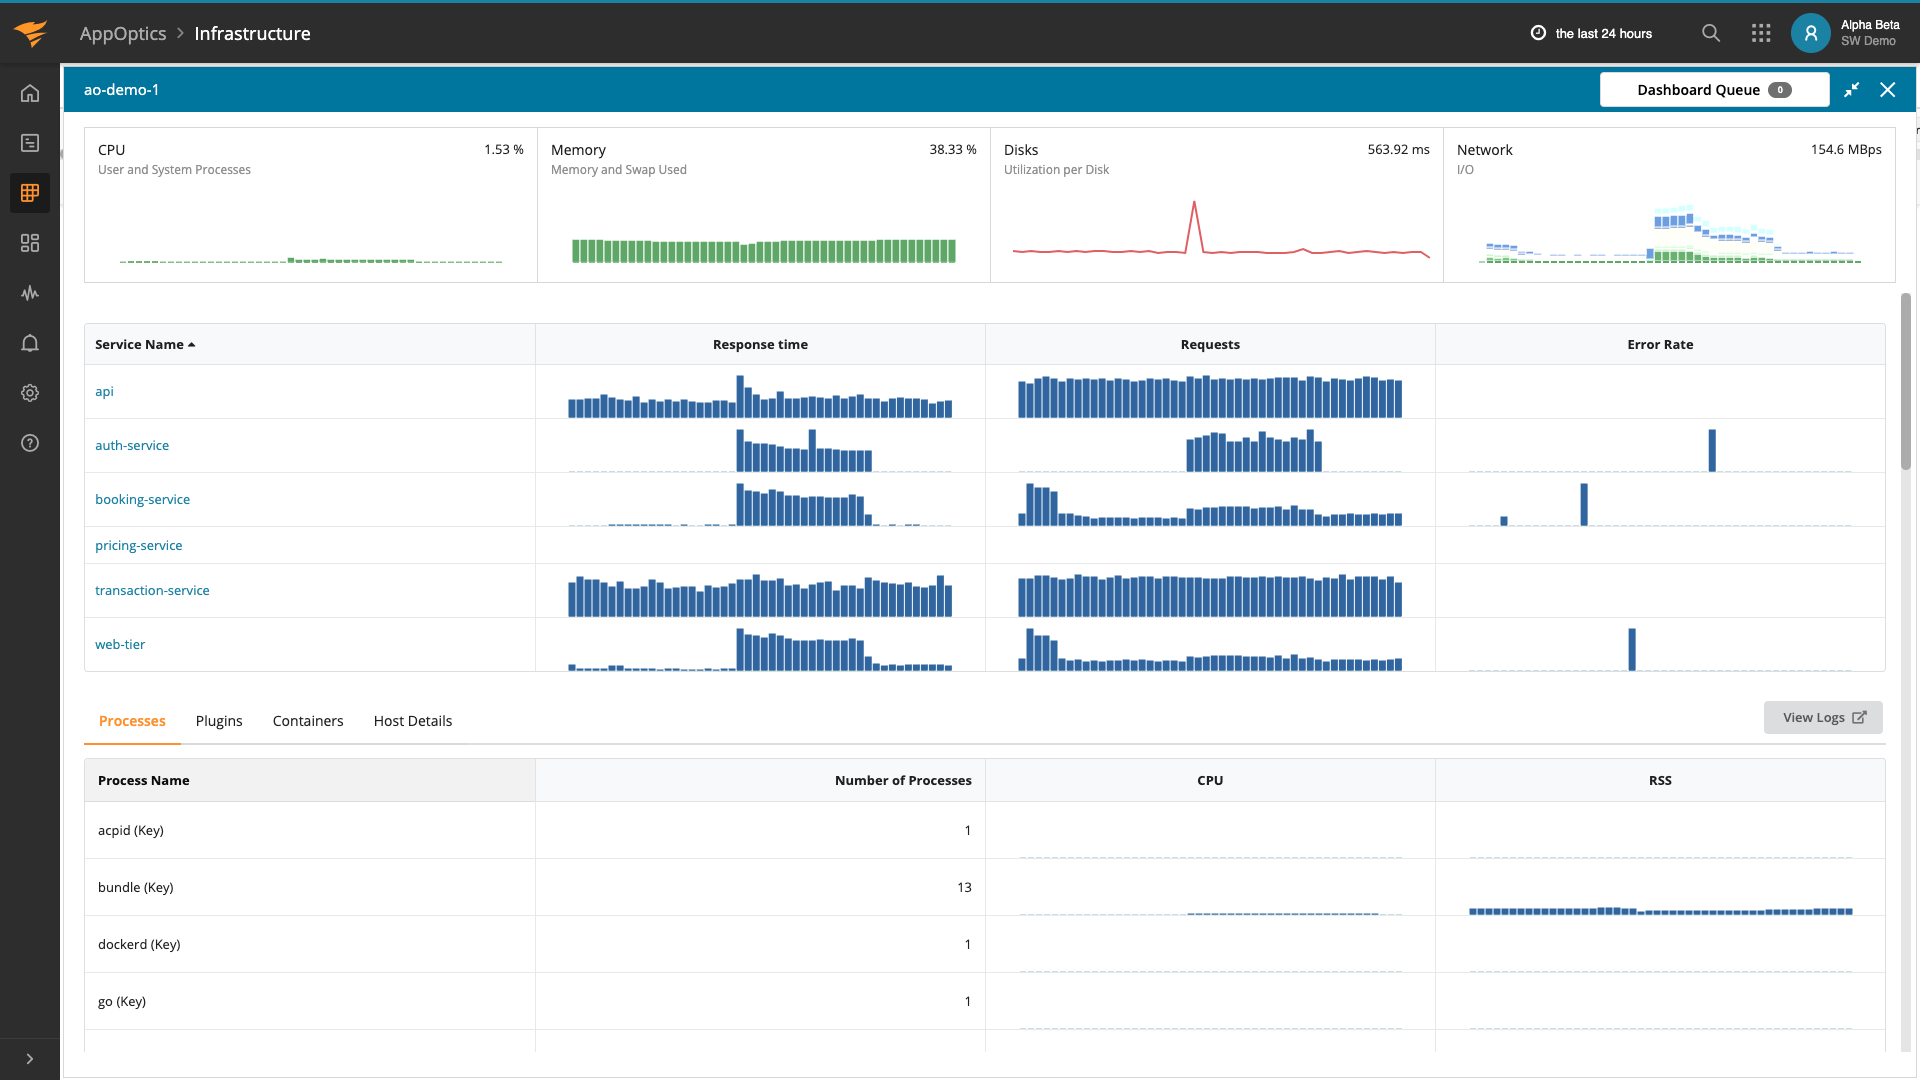
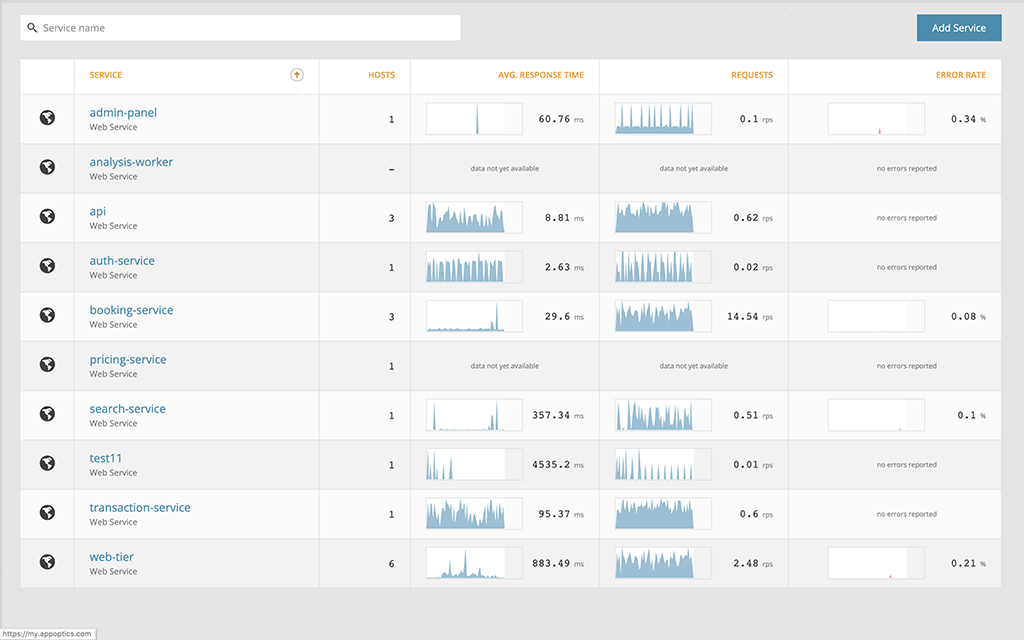
APM is often called the “inside-out” or server-side way of monitoring your system. Tools like SolarWinds® AppOptics™ nestle themselves throughout the application’s infrastructure back-end components, measuring resource usage and tracking response times, requests, and errors as the applications are executing. With distributed transaction tracing across the application, performance bottlenecks can be identified and solved quickly.
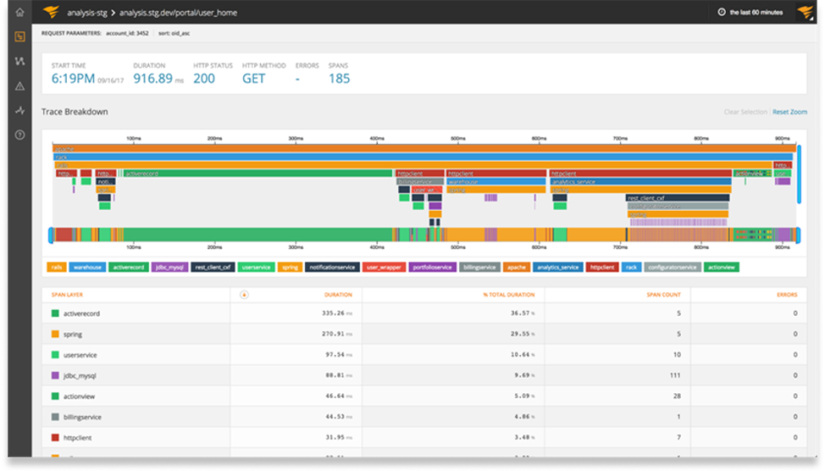
The scope of APM is to deep-dive into the internal application components and infrastructure, pointing out everything from contributing factors to performance issues, down to the code level. APM tools are often used to load test application infrastructure to help plan out future scalability to accommodate the growing number of users, more data (like products in an e-commerce store), and more features and functionality. APM tools are great to discover application error messages, bugs and crashes that otherwise would go unnoticed.
Real User Monitoring
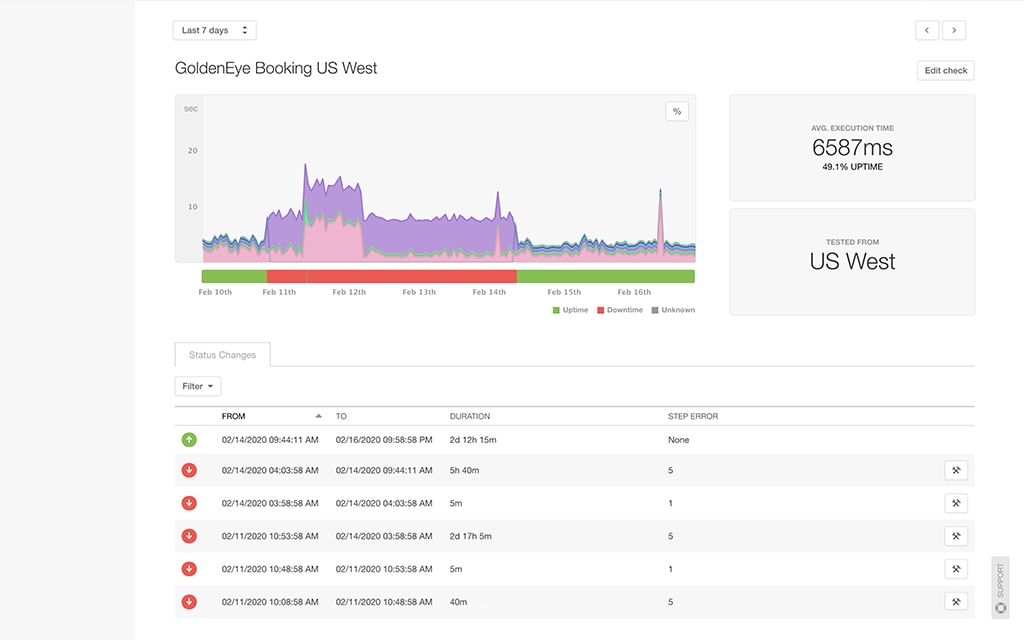
RUM takes the “outside-in” or client-side approach. Tools like SolarWinds Pingdom®, a web application monitoring tool that includes both synthetic and real user monitoring, measure real user experience and performance to help you isolate how your users’ digital experiences are different, regardless of location. The scope of RUM monitoring is much broader, but less deep, than APM.
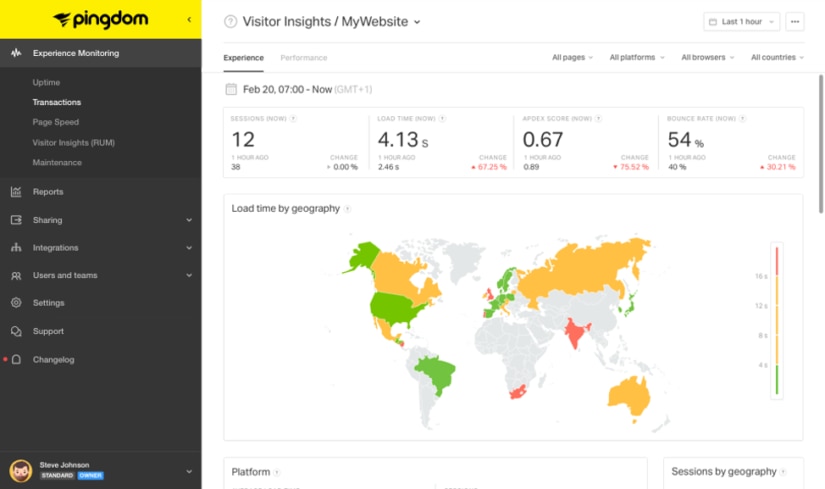
RUM tracks outside of the direct control of the web app, and includes monitoring “client-side” components like the user’s (mobile) device, browser, internet connection, and everything else between the user and web application. This gives a much more realistic picture of a single user’s actual digital experience, even if it includes factors outside of the web app team’s control.
RUM tools show that users in a specific geography or using a specific browser may be experiencing the slowness of your website. With this telemetry available, you can take immediate action to resolve issues for affected users.
And/Or?
While both tools fulfill different monitoring needs, they both serve a common goal. APM gives a rich and detailed view into the application and its infrastructure, conveying why your site is slow, while RUM provides insight on the end users’ experience and behavior with the application.
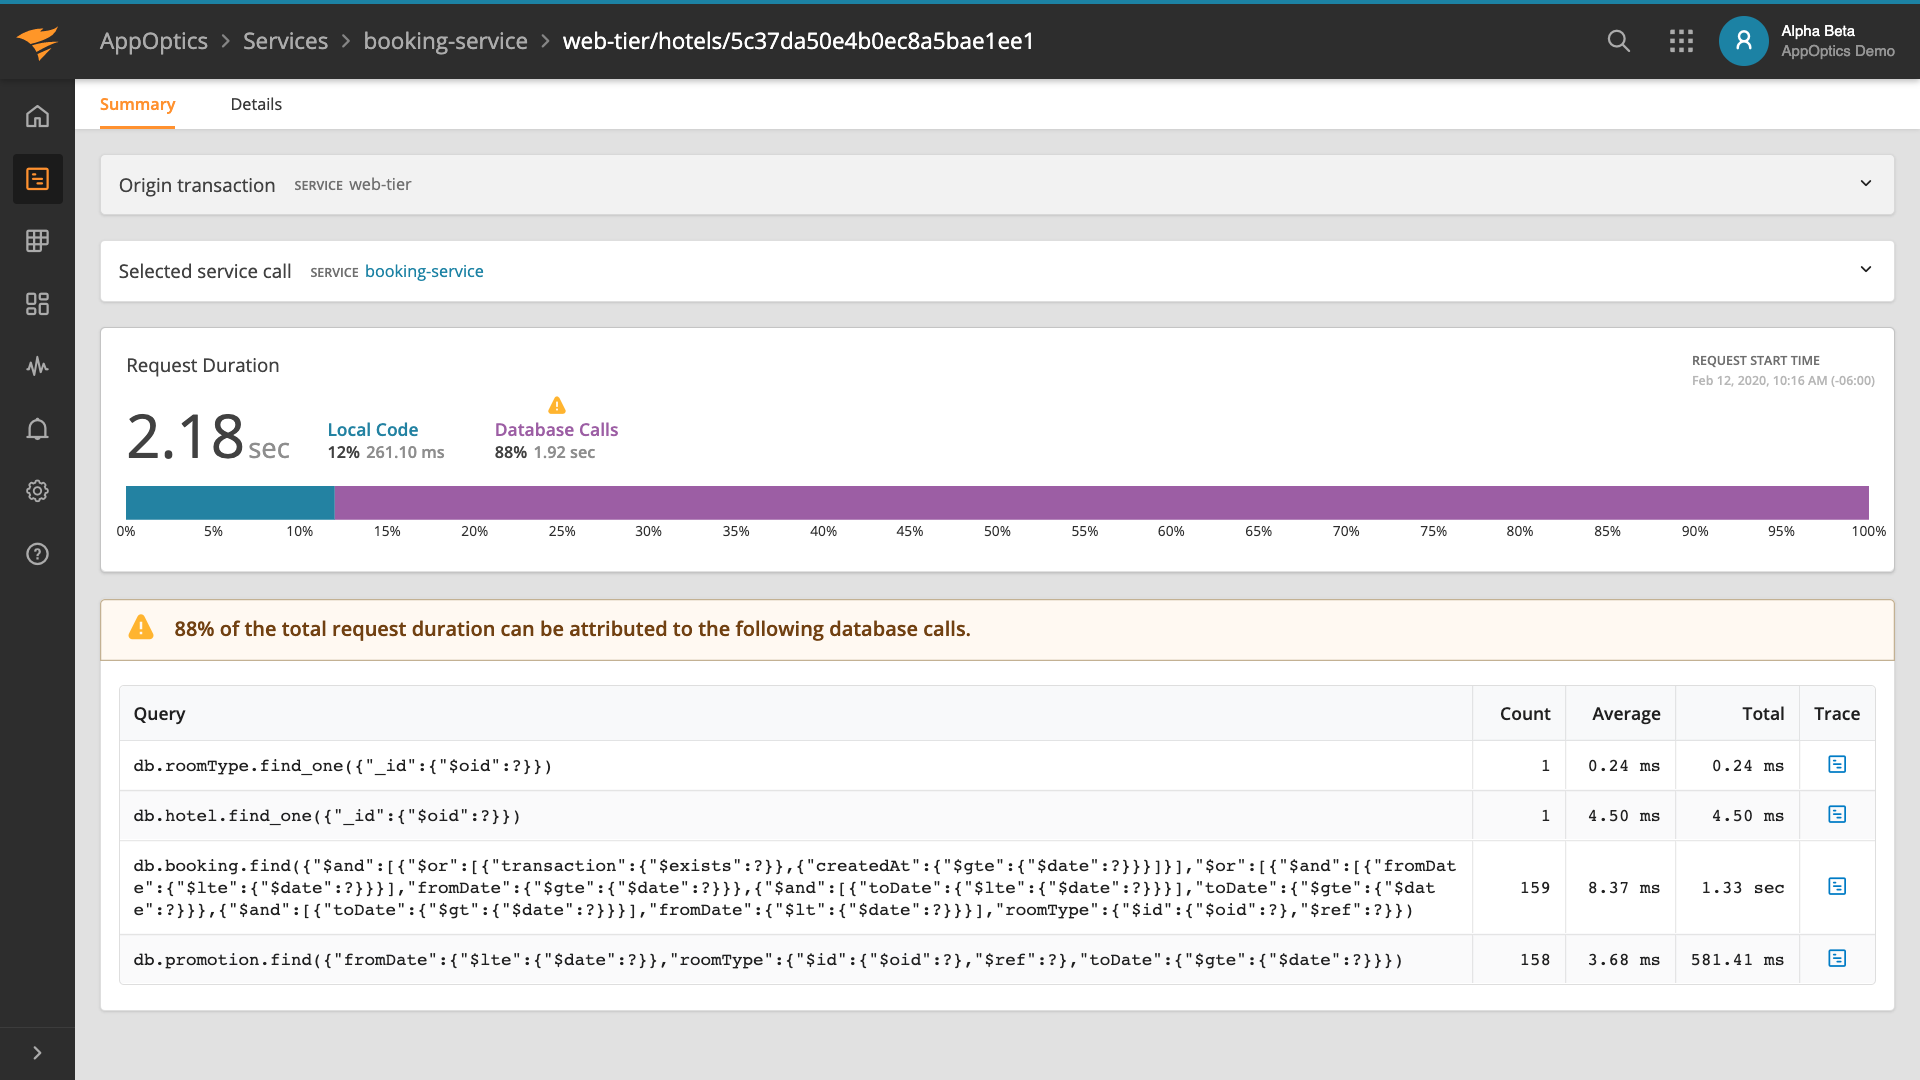
APM is great to drill down into code-level issues. It takes “traces” of user transactions that traverse the web application and identifies potential bottlenecks and contributing factors to issues. APM tools, like AppOptics, can be used by both development and operations teams to look for issues proactively and apply optimizations to them.
RUM is useful for seeing the end-to-end customer experience, and troubleshooting problems affecting your web application caused by external components. RUM can also help you monitor what impact web application changes have on the customer experience.
Conclusion
It’s not APM vs. RUM, it’s APM + RUM. They’re two sides of a coin, working together to improve application performance and provide a great end user experience. When a UEM tool like Pingdom tells you the site is slow, AppOptics can tell you why.
The bottom line: if you haven’t added tools like Pingdom and AppOptics to your application performance monitoring practices, now is the time to do so.
