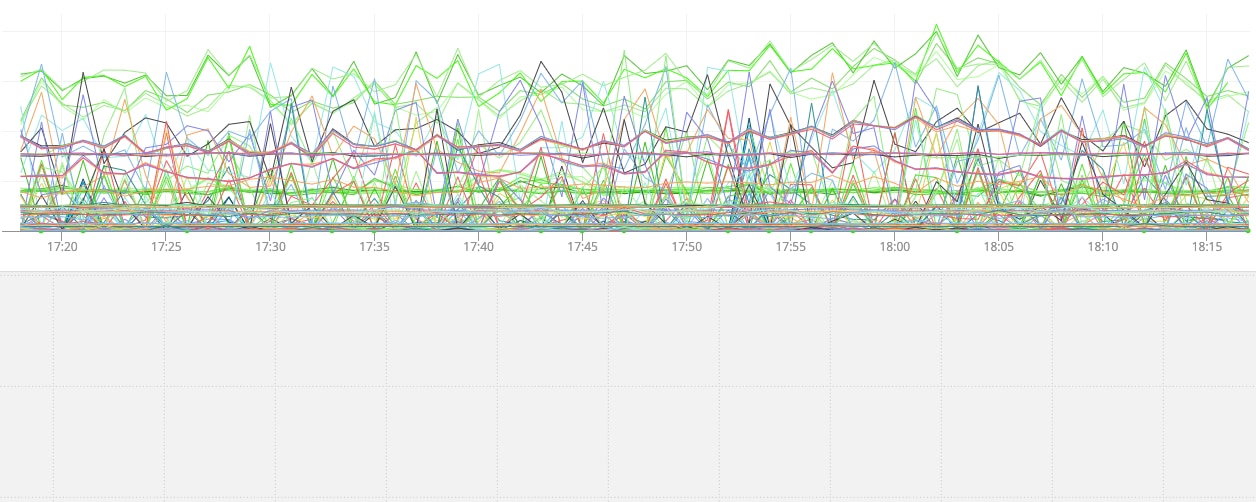
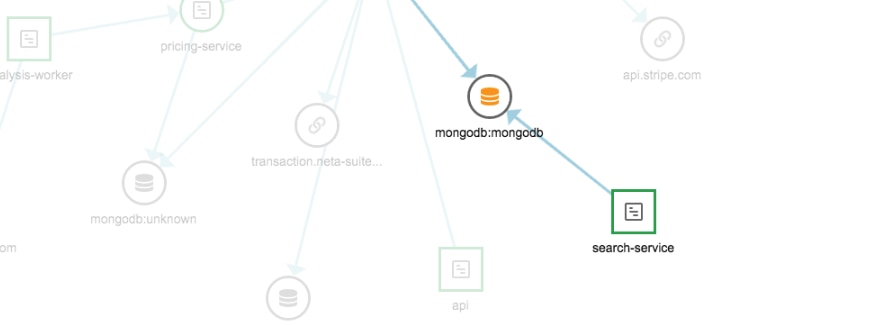
Application performance monitoring (APM) is the process of measuring application processes and transactions. This process lets you analyze how an application is performing based on statistics related to availability, response time, and other common APM metrics like error rate, application and server CPU usage, application instances, and request rate. APM also allows you to use this information to troubleshoot performance problems. For effective application performance monitoring, you should know immediately when key statistics cross thresholds, signaling potential issues. This requires automated alerts and notifications.
Alerting is at the center of SolarWinds® AppOptics™. AppOptics includes tools designed to let you create actionable alerts with a high signal-to-noise ratio. The AppOptics alerting system allows you to link your APM alerts with several notification services, including email, SMS, and various web services. You can even set up your alerts to automatically notify you through multiple platforms at once and to alert several individuals or teams.
AppOptics currently supports 10 notification and escalation services.
AWS SNS: Real-Time Alerts
Amazon Simple Notification Service (SNS) lets you coordinate and manage message delivery to endpoints. The service is often used to route notifications from services and applications to endpoints through user-defined “topics.” The endpoints supported by SNS include email, HTTP, SMS, and even other Amazon services.
AppOptics supports SNS notifications, allowing you to create custom delivery pipelines for your AppOptics alert notifications. When sent through SNS service integration, the notifications include a JSON payload you can deconstruct and consume programmatically.
To configure AppOptics with SNS, you first need to define an SNS topic and subscription. When you add a topic, SNS will generate an Amazon Resource Name (ARN). The ARN is where messages can be published and the subscription can read messages. Once you have this information, you can add the AWS SNS configuration by going to “Settings” in AppOptics and navigating to “Notification Services.” You can then click “Add Configuration” and enter your SNS information in the appropriate fields.
Learn more: AWS SNS
BigPanda: Flexible Notifications for SysAdmins
BigPanda lets you receive alert notifications through SMS, email, mobile push, or phone calls. Once you receive an alert, you can manage the alert’s life cycle through the BigPanda web UX or through their mobile app.
To configure BigPanda for integration with AppOptics, go to the “Integrations” page in your BigPanda account. Click on “New Integration” and add AppOptics. Once you choose a name for the integration, the platform will generate an App Key. Copy this and the token so you can add this information in the AppOptics configuration page. After you add BigPanda as a new configuration in AppOptics, the payload will be sent to BigPanda as an incident when your alerts fire.
Learn more: BigPanda
Email: APM Alerts Sent Directly to Your Inbox
For people who don’t want to engage with an additional notification service, integrating AppOptics with email is a straightforward way to notify the necessary actors when an alert threshold is crossed.
To configure email notifications through AppOptics, you need to go to the settings. From there, go to the “Mail” integration and click “Add Configuration.” There, you can enter the title for the integration and decide which email addresses should be sent notifications. When an alert fires, the payload will be emailed to your selected recipients.
Learn more: Email
Flowdock: APM Notifications for IT Pros
Flowdock is an inbox shared by teams, and it includes a group chat. It’s designed to help teams stay up-to-date and quickly react to alerts. By integrating Flowdock with AppOptics, you can automatically send snapshots and alert messages to a flow.
Integrating Flowdock with AppOptics involves the same basic steps as the other integrations discussed above. First, you need to get an API token from your Flowdock account settings. Then, you can enter the token when adding the Flowdock configuration in AppOptics to make sure your alerts go to the right flow.
Learn more: Flowdock
Opsgenie: Get Alerted Immediately
Opsgenie lets you receive alert notifications via email, SMS, mobile push, or phone calls. Like BigPanda, Opsgenie lets you manage the life cycle of the alert from either its web UX or its mobile application.
To configure Opsgenie and AppOptics, you need to get the integration API key from your Opsgenie settings. You can then use the key to configure the notifications. With Opsgenie, alerts can be sent to individuals or entire teams depending on what best suits your needs.
Learn more: Opsgenie
PagerDuty: AppOptics Alerts in Real Time
PagerDuty lets you receive alerts through SMS, email, or phone calls. It also lets you set up automatic alert escalation and on-call duty scheduling for your ops teams. You can set up AppOptics to work with multiple PagerDuty service destinations.
You can add AppOptics in PagerDuty by clicking on the “Services” tab and clicking “Add New Service.” Enter a name and select an escalation policy for your new service, selecting AppOptics as the integration. Once you add the service, you will get the API key, which you can use to configure your AppOptics account so your alerts are sent to PagerDuty.
Learn more: PagerDuty
Slack: APM Alerts for a Popular Messaging Platform
Slack is a messaging center for modern teams. It brings all your communications together in one place with real-time messaging, archiving, and searching. Teams using Slack often rely heavily on it, which means they’ll see alerts as soon as they come in. The AppOptics Slack integration supports snapshots and alerts, ensuring teams quickly get the information they need sent directly to their team communication dashboard.
Learn more: Slack
APM Integration for VictorOps
VictorOps integration lets you send AppOptics alerts to your VictorOps timeline, which allows you to use the service’s notification management features in relation to your AppOptics alerts. When an alert fires, the payload is sent to VictorOps. From there, you can click on the alert to bring up a screen with more alert details and links to help you manage the alert life cycle.
Configuring VictorOps with AppOptics is similar to the other integrations in this article. Once you get an API key from VictorOps, you can use it to integrate the two services.
Learn more: VictorOps
Webhook Notifications for APM
A webhook is a simple event notification sent via HTTP POST. The webhook service in AppOptics sends the alert payload to a URL you specify whenever your preset alert is triggered.
Adding the configuration involves going to the AppOptics settings and entering the URL address you want to receive a POST request any time an alert is fired with the service. The POST request will be in the format the webhook handlers’ github-services suite uses.
Learn more: Webhook
Custom Zapier Alerts for Ops Engineers
The Zapier platform connects the apps you use so you can move data between them. You can take advantage of the webhooks in Zapier to integrate more than 400 applications and services.
With Zapier, you can have your alerts sent directly to you instead of needing to route them through other incident management services like PagerDuty or VictorOps. Afterward, you can create a custom alert delivery pipeline through any of their supported actions.
Learn more: Zapier
Get Started with APM Alerting
Alerting is at the center of any successful application performance monitoring and management solution. By integrating SolarWinds AppOptics with these notification services, you can help make sure you’re aware when an application condition crosses an alert threshold and requires your attention.


