Given that load balancers are responsible for distributing incoming network traffic, their health and efficiency are critical for system availability. In this article, we’ll give you an introduction to load balancer monitoring, review the most important metrics to monitor, and show you how to use them to troubleshoot problems in your website and apps.
Why Load Balancer Monitoring is Essential
A load balancer is a service (software or hardware) that takes a request from a client and transparently directs the request to the appropriate service or host. When the service has finished processing the request, it’s routed back through the load balancer and returned to the client.
Since the load balancer sits between the client and the backend, it has the unique opportunity to provide a wealth of services to our application, including scalability and redundancy. They can also monitor the health of your backend servers and offer insight to service health and latency. If there’s an availability problem either in your load balancer or in the backend services, you need to know right away to prevent customers from losing access to your service.

Types of Load Balancers
A load balancer is typically a client’s first point of contact with your system; whether your client is a customer-facing website, mobile application, or another system. A load balancer enables you to scale your system transparently and provide reliability through redundancy.
The most common types of load balancers are software, hardware, and managed service. Software load balancers like Nginx and Haproxy are installed on a server or in a container. Hardware load balancers like those from F5 have specialized chips to enable higher loads. Cloud platforms like Amazon Web Services (AWS) also offer load balancers as managed services. We’ll focus on AWS since they are popular and can serve as prototypical examples for the others.
AWS offers a set of load balancers collectively called Elastic Load Balancers (ELB). The three types are: Application Load Balancer (ALB), Network Load Balancer (NLB), and Classic Load Balancer (CLB). Load balancers are typically defined in relation to the Open Systems Interconnect (OSI) model. OSI defines seven layers for the network traffic, starting at physical layer and ending at the Application layer. Here is the seven-layer model and where each load balancer type operates:
- Application ← ALB and CLB
- Presentation
- Session
- Transport ← NLB and CLB
- Network
- Data link
- Physical
An ALB operates at the application layer (level-seven or L7) and only knows about HTTP connections. The CLB operates at both the L4 and L7 layers. AWS recommends using the ALB or NLB over the CLB. The image below highlights how an ALB operates at L7. In this example, the ALB is the termination point for Transport Layer Security (TLS). The ALB decrypts the payload and send it on to the service. If you needed TLS between the ALB and the service, the ALB would need to re-encrypt the payload and send it to the service.

The NLB operates at the transport layer (level-four or L4) and only knows about TCP connections. If you compare the ALB diagram above with the NLB diagram below, you’ll see the NLB does not terminate TLS. This further highlights the differences between the two types of ELB.

Here’s a breakdown of the services supported by each type of load balancer:
| AWS LB types: | Application Load Balancer | Network Load Balancer | Classic Load Balancer |
| Protocol | HTTP, HTTPS, HTTP/2 | TCP | HTTP, SSL, HTTPS |
| SSL Offloading |  |  | |
| IP as Target | | | |
| Path-based routingHost-based routing | | | |
| Static IP | | | |
| WebSockets | | | |
| Container Support | | | |
Table 1: Load Balancer Support
Why is it Important to Monitor Your Load Balancers?
Monitoring load balancer metrics provides you with insight into how your system is performing. The load balancer can tell you how many clients are accessing your services and how long it’s taking your service to respond to these requests. By monitoring these metrics, you will be able to immediately determine if there is an operational problem that affects your web services. When there is a critical production issue, you need to be aware and respond immediately to contain the damage and reduce impact on customers. Since the load balancer is always checking the health of a service, it can inform you of potential issues in your service before they overwhelm your system.
If you just released a new version of your service and the error count suddenly increases, you can perform a rollback before your customers know there’s an issue. Additionally, this information can help you quantify customer growth and gives you a baseline or benchmark for system performance. It enables you to monitor traffic patterns and provides you with insight into the time of day your system is used and respond to spikes in demand so you can provision capacity appropriately.
Load Balancer Monitoring Basics
Load balancer metrics report on three broad categories: clients of your service, the load balancer itself, and the target service. Client specific metrics report on how client connections with your service are performing. LB specific metrics report on the actions the load balancer takes to mediate requests. Target service specific metrics tell you how your service is performing.
Collecting Load Balancer Metrics
The ELB service at AWS is a fully-managed service, meaning there is no EC2 instance for you to manage. Since there’s no host to install a monitoring agent on, you need to connect your SolarWinds® AppOptics™ account to your AWS account. Once integrated, you can choose which cloud services you want AppOptics to monitor.
For other load balancers (e.g. Kong) you may be using a compute instance to run your load balancer. In this case, you’ll want to install the AppOptics host agent configured with the correct plugin.
Key Load Balancer Metrics
Here are the five key metrics to track for a load balancer: latency, rejected connections, 5xx status codes, target host health, and connection count.
Latency
Latency represents how long it takes for your service to process a request. Specifically, it’s the time from when a request leaves the ALB (not including time spent at the ALB) until it returns. This metric is measured in seconds and is reported on in percentiles; typically the 95th and 99th percentile.
There is no “correct” value for latency; rather it’s a reflection of your service and the problem your service addresses. In general, latency should be as close to zero as possible, but if your service requires five seconds to process a request then that’s your target latency. This is where your SLAs come into effect. Be sure your latency is within your SLA.
Rejected Connections
RejectedConnectionCount represents how many client connections were rejected by the load balancer. If you are using an AWS CLB, it has a similar metric called SurgeQueueLength. Both of these metrics count the number of requests the load balancer had to reject (or hold and send later) because your target application could no longer service incoming requests.
5xx Status Codes
How do you stay ahead of potential issues experienced by users of your service? Monitor the error codes generated by your application.
5xx Status Codes count the number of 5xx HTTP status codes returned by your service. This metric is only applicable to L7 load balancers. As the name implies, this metric tells you if your service or if the load balancer is failing to process client requests.
Most L7 load balancers will track each of the 2xx, 3xx, 4xx and 5xx HTTP status codes returned by your application. They also track 2xx, 3xx,4xx and 5xx HTTP status codes returned by the load balancer itself. Of these, the 5XX class is a good place to start monitoring.
Target Host Health
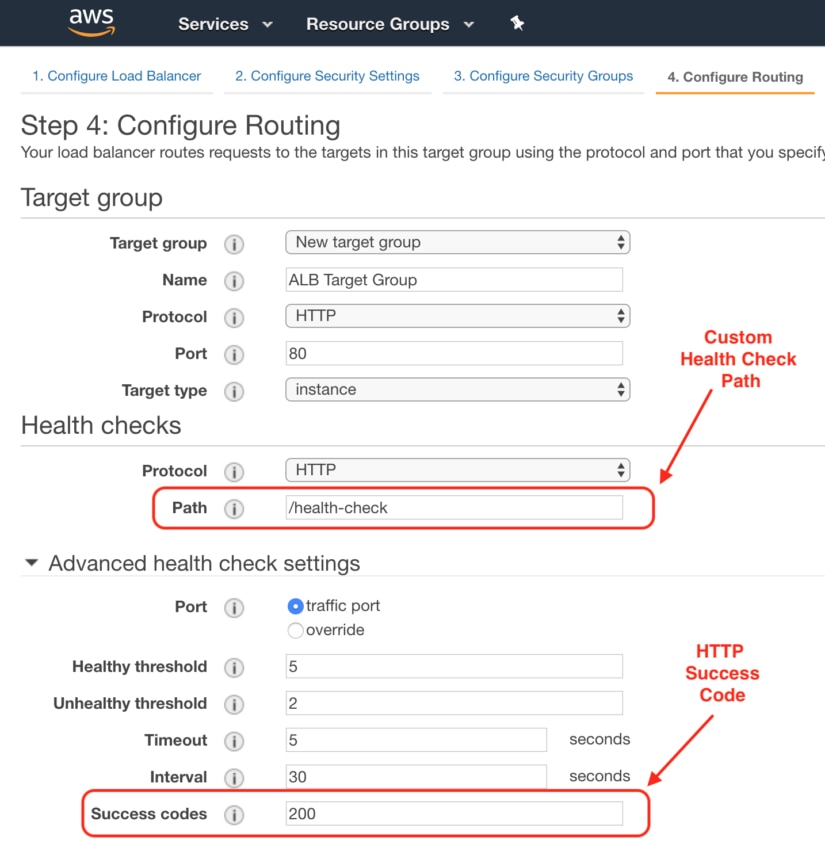
All load balancer types report on the health of your services. There are two metrics to track your service: HealthyHostCount and UnHealthyHostCount. We want to track the unhealthy host count because it tells us if a service is failing its health check. When you create a load balancer, you define a health check and the success status code for your service. This health check guides many of the behaviors of a load balancer. Here’s how you configure the health check for an AWS ALB:
Connection Count
Connection count refers to the number of clients connected to your Load Balancer. An NLB may call this the “active flow” (or something similar) because NLB’s are a transparent pass-through for TCP traffic. Unlike an ALB, client request do not terminate at the NLB. Therefore, the NLB has a slightly different metric.
Troubleshooting with Load Balancer Metrics
When troubleshooting load balancer metrics, it’s important to understand which components are being impacted. Ultimately, when your system isn’t performing as expected, your clients are impacted. The various load balancer metrics discussed above will help you determine where to look first.
For example, how do you know if you have enough services running to handle the incoming load (rejected connections)? Did your last deployment introduce a bug (5xx status codes or target host health)? How many clients does your application have (connection count)?
Slow Response Time
How do you know if your service is taking too long to process a request? Does your service have an SLA for response time? Do you have enough services running to adequately handle your client load? The first metric to look at for response time is Latency. There are many different reasons for higher-than-expected latency:
- Check your service – What’s the CPU utilization of your service? Is there enough memory for the service? Is it running out of threads? Is your service waiting on a shared resource? See our “In-Depth Guide to Host Monitoring” for more on how to troubleshoot your application.
- Resource contention – If your application uses a shared resource like a database, check your database’s metrics. Is the shared service under high CPU load? Is it taking longer than normal to process requests? If you are using an RDBMS, did you run a query report?
Troubleshooting cross-service contention is where a tool like AppOptics really shines. By creating a dashboard that contains all components of your service, e.g., the ELB, target service and shared resources, you can get a holistic view of where the contention may be originating. A custom dashboard will allow you to compare the same time window across various services.
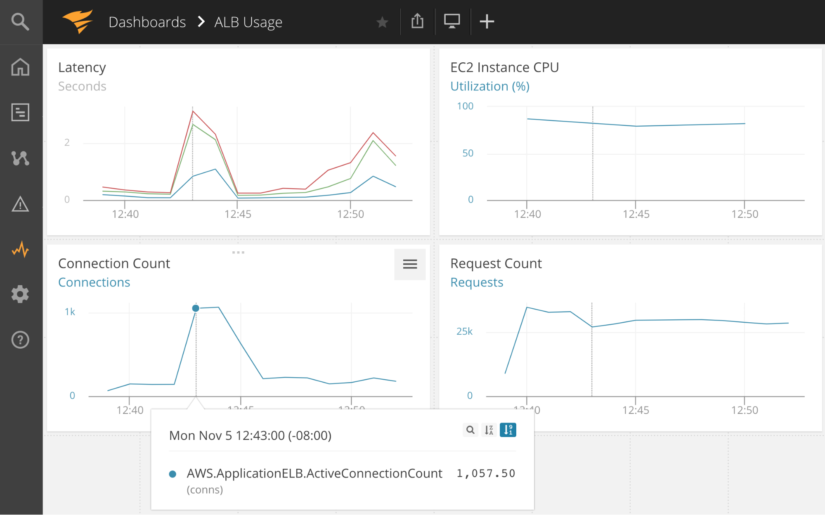
With this custom AppOptics dashboard we can see the load balancer target latency, EC2 instance CPU usage, connection count, and the number of requests being processed. Looking at the 12:43 mark in the dashboard below, we see a dramatic increase in both connection count and request count. This also resulted in an increase in latency to over three seconds. Google has published data showing that 53% of mobile site visits are abandoned if a page takes longer than three seconds to load. Let’s assume we have a service level objective that 95% of responses occur in less than two seconds. To meet this objective, we need to increase the size of the EC2 instance and/or run more instances of the service to support the higher client load.
Service Errors
When troubleshooting a 5xx error, a good starting point is your application’s log files. Centralized logging makes it easier and faster to track down where the error originated. Tools like SolarWinds® Loggly® can be very helpful for this type of troubleshooting.
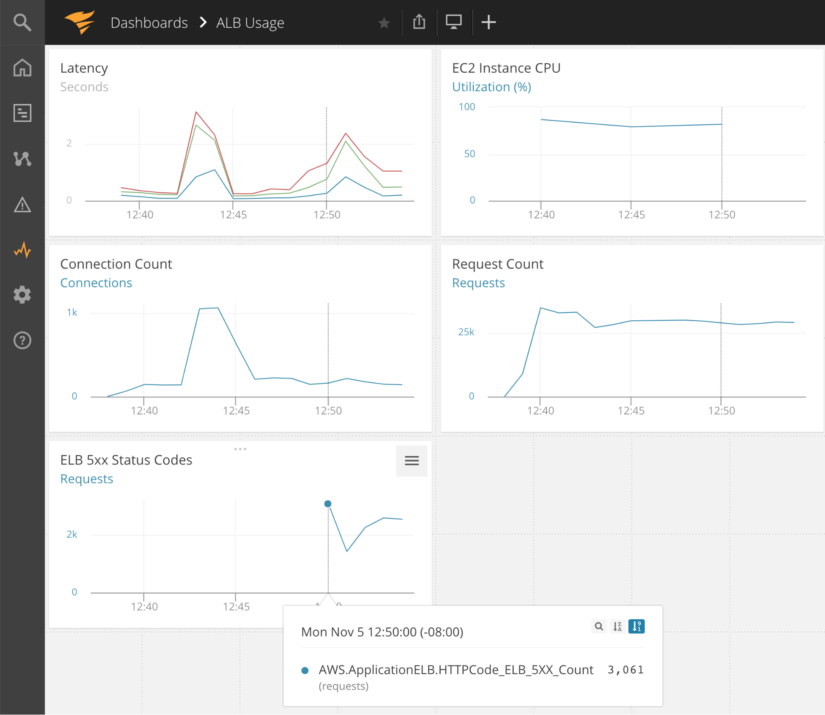
Using the same custom AppOptics dashboard as before, we’ve added an “ELB 5xx Status Code” chart (bottom left). Prior to 12:50, there weren’t any errors. Now there are more than 2,000 HTTP 5xx Status Codes, which in turn is most likely contributing to another increase in latency. With a time range, we can quickly check our application log files to see what happened to trigger the 5xx error codes. It also looks like a few clients are making the majority of the requests. Even though the connection count dropped, the request count stayed relatively flat.
Service Health
Troubleshooting an unexpected increase in the “unhealthy host count” metric can be difficult to track down. The first place to start is with your health check. Do you have a deep health check, one that takes a long time to complete? This can happen when the health check includes too many additional services as part of its health assessment. If your code itself isn’t the issue, check the load balancer health check configuration as you many need to adjust timeout settings.
A shallow health checks (one that doesn’t check anything meaningful) can also hurt your application. In this case, the load balancer thinks your application can handle more traffic when in fact it’s potentially at capacity. You want a health check that will be responsive while accurately reflecting the processing capacity of your service.
Too Many Connections
What happens when the demand for your service exceeds your configured capacity? The cloud enables you to scale infinitely but your system design needs to support this scalability. How can you stay ahead of the demand? Connection count, latency, and rejected connections give you insight into the growth of your clients and how your application is meeting the load.
As your connection count rises, you’ll want to watch your latency metric.
A spike in rejection count could point to a capacity issue, your targets are too busy for the load. A first step to alleviating a high rejected connection count is to increase the number of target services for your load balancer. Since adding another instance may exacerbate the problem, be prepared to decrease your instance count if needed.
App Performance
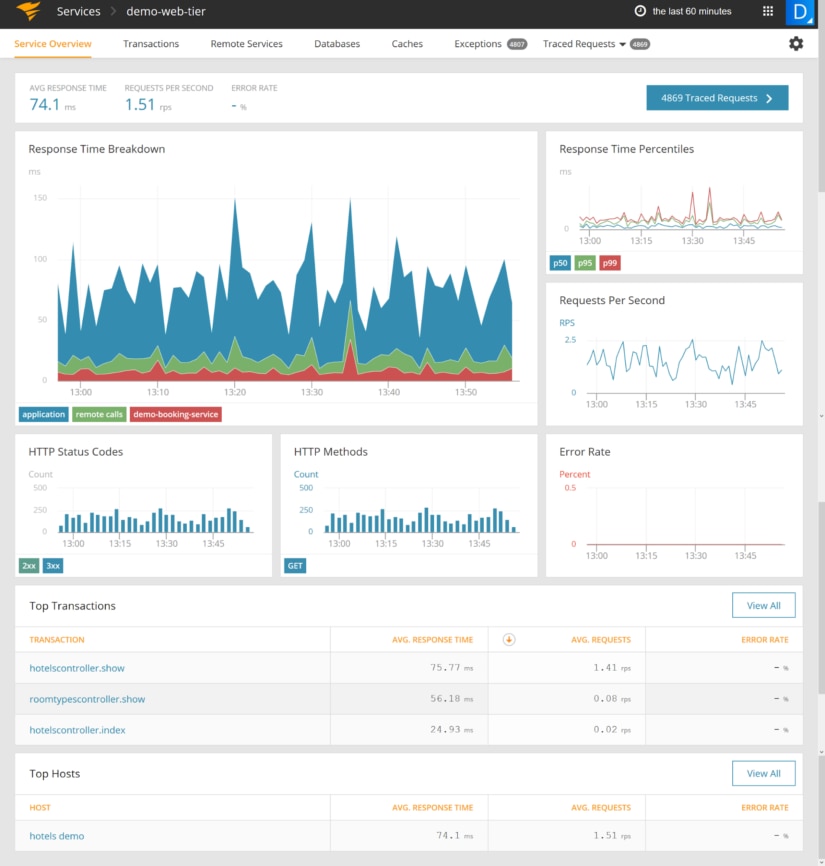
The load balancer might be a good place to monitor all your services, but often you need to drill down to the application level to find the cause of latency and errors. AppOptics offers built-in application performance monitoring (APM) that lets you see the response time from your application, and even trace transactions distributed across your stack.
The metrics outlined here are a good starting point for load balancer monitoring. As you have more experience with your application in production, and a better understanding of your clients’ traffic patterns, the metrics you focus on will change. A monitoring solution like SolarWinds® AppOptics® gives you a great starting point with default dashboards for common load balancers and the flexibility to customize the metrics most important to you. It’s easy to set up and takes just a few minutes, so you have no excuse not to monitor this critical part of your infrastructure.