Maybe you’ve been there. You’re a VP of engineering, or a product owner. There was a critical outage in one of your apps, and it took your team an entire week to track down and fix the issue. Customers and revenue were lost. Now you’re sitting in a review meeting with a consultant hired to figure out what happened and why.
You’re a little nervous because you know you’re not monitoring everything. After all, monitoring systems is expensive and time-consuming. But you’ve been through the process of labeling what’s critical and what’s not. Your ops team is good, your apps are working, and your track record is solid—even with last month’s outage. This issue just happened to be labeled tier 2, or “not critical,” but you’ve since bumped it up to tier 1 where it belongs.
“So, tell me,” the consultant says, “why are you monitoring your applications?”
You relax. This is going to be easier than you thought.
“Even in the best systems,” you say, “there will be problems, and problems cost money. So, we need to know as much as we can when problems occur. Without monitoring, we’ll know something is wrong, but we won’t know any details. And while the ops guys are searching for answers, we’ll be losing sales. Monitoring tells us exactly what went wrong and where to look.”
“I see,” says the consultant. “So, you’re monitoring all your business-critical applications?”
“Yeah. We just happened to miss this one.”
“Why aren’t you monitoring every application—even the non-critical ones just to be safe?”
“It’s too expensive,” you say. “And there would be too much data—all those logs and metrics. We’d never be able to parse through it all.”
“So how do you choose which applications are critical?”
“It’s the important ones,” you say. “ERP, finance, CRM, payroll, call center, the ecommerce platform…”
“OK,” the consultant says. “But those are systems, not applications. Systems are made up of applications: authentication services, web apps, databases. Are you monitoring all those components?”
You feel a little uncomfortable. “Well,” you say, “yeah. Sort of. We’re monitoring most of them. But that’s a lot of applications.”
“What about your microservices? And your cloud APIs?”
“We can’t monitor everything,” you say. “We have budgets and time constraints.”
“And on the applications you are watching, what metrics are you monitoring?”
“Mostly just performance. Transactions per second, database response time, that kind of thing.”
“That’s it?” he asks.
You already know why it took you so long to track down your outage, and so does the consultant. It’s because you’re not monitoring everything you should. You’ve sacrificed coverage for budgets and time. That’s how it’s always been.
But it doesn’t have to be this way.
Let’s step back and see what went wrong. We’ll look at how to identify your business-critical systems, why those systems are so complex and difficult to monitor, and how using application performance monitoring (APM) can help you monitor all your systems with simplicity, ease, and minimal costs.
What Is a Business-Critical Application?
First, let’s look at what makes an application business critical. A great place to start is by defining your critical processes—flows required for the survival of your business. For example, a freight company delivering goods to supermarkets might consider their supply chain management process to be critical. An online hotel booking company might identify their reservation workflow to be critical. Business-critical processes make or break your business.
Once you identify business-critical processes, the next step is to define what critical applications power those critical processes. For the travel company, it might be the front-end application, a shopping cart application, a payment processing application, and the application that calls wholesaler APIs.
Then, once you identify the business-critical applications, you know what you need to monitor. If any of these parts stop working, your process is broken, and customers are lost. However, identifying all these components is notoriously difficult, especially with the complexity of modern architecture.
Modern Business-Critical Applications Are Complex
Monitoring was easier years ago. Systems were monoliths running on user workstations and calling databases directly. However, as the years passed, systems became more complicated, implementing a three-tier architecture: a database, an app, and the presentation layer. And more recently, complexity has multiplied with the introduction of microservices, hybrid and multi-cloud, and container and orchestration systems.
In a modern application, you might now need to monitor hundreds of microservices for your travel booking app, monitor hybrid-cloud applications both on-prem and on public cloud, or monitor multi-cloud communications between two vendors. And with modern DevOps, you might need to monitor containers and complicated orchestration systems such as Kubernetes, just to be sure your deployments work.
These modern architectures might add reliability and scalability, but they also add abstraction, complexity, additional points of failures, and significantly increase monitoring needs. And even if you can monitor all these components, you now have a major problem: information overload. The sheer number of metrics and logs from your business-critical applications can be overwhelming. It’s impossible to continuously watch these metrics and logs.
Don’t Compromise Your Monitoring
As a result of all these applications creating all this information, teams compromise what they label business critical. They may decide to monitor the slow query log, CPU, memory, and disk space of the database, but not the read/write throughput. They may decide to monitor the microservice that calls the bank API, but not the one that emails customers.
The result of this compromise? The scenario at the beginning of this article. One day your application grinds to a halt. You check the app’s logs, the message queue, the alerts, but you can’t find the answer. Your queries are well-tuned and tested. Your DBA swears indexes are up-to-date. Yet your whole team is spending days trying to track down the issue.
However, if you’d monitored all your truly critical apps, if you’d watched all your available metrics, you would have quickly found an answer. Your read/write throughput was higher than normal, causing locks on your table and slowing your queries, pushing the CPU to its limits. With thorough monitoring, you could have quickly traced the problem back to the culprit: a recent application change causing a high volume of write requests.
A single missing metric or monitor can cause days or even weeks of lost time and revenue.
Application Performance Monitoring (APM)
This is why APM exists. APM integrates with your applications to collect, process, analyze, and correlate information from all your components. Simply put, APM gives you a holistic view of all your applications, from the “bird’s-eye view” of a problem down to the root cause.
And if you use SolarWinds® AppOptics™ as your APM tool, cost is no longer an issue. You won’t need to choose which applications or metrics to monitor. With AppOptics, you can afford to monitor all the metrics of all your business-critical applications, orchestration tools, and cloud platforms, all in one simple, elegant, easy-to-use view.
SolarWinds AppOptics
AppOptics is a comprehensive monitoring solution that allows you to create dashboards for all your applications, databases, servers, networks, and infrastructures all side by side. To start, a quick look can tell you which layer is experiencing issues.
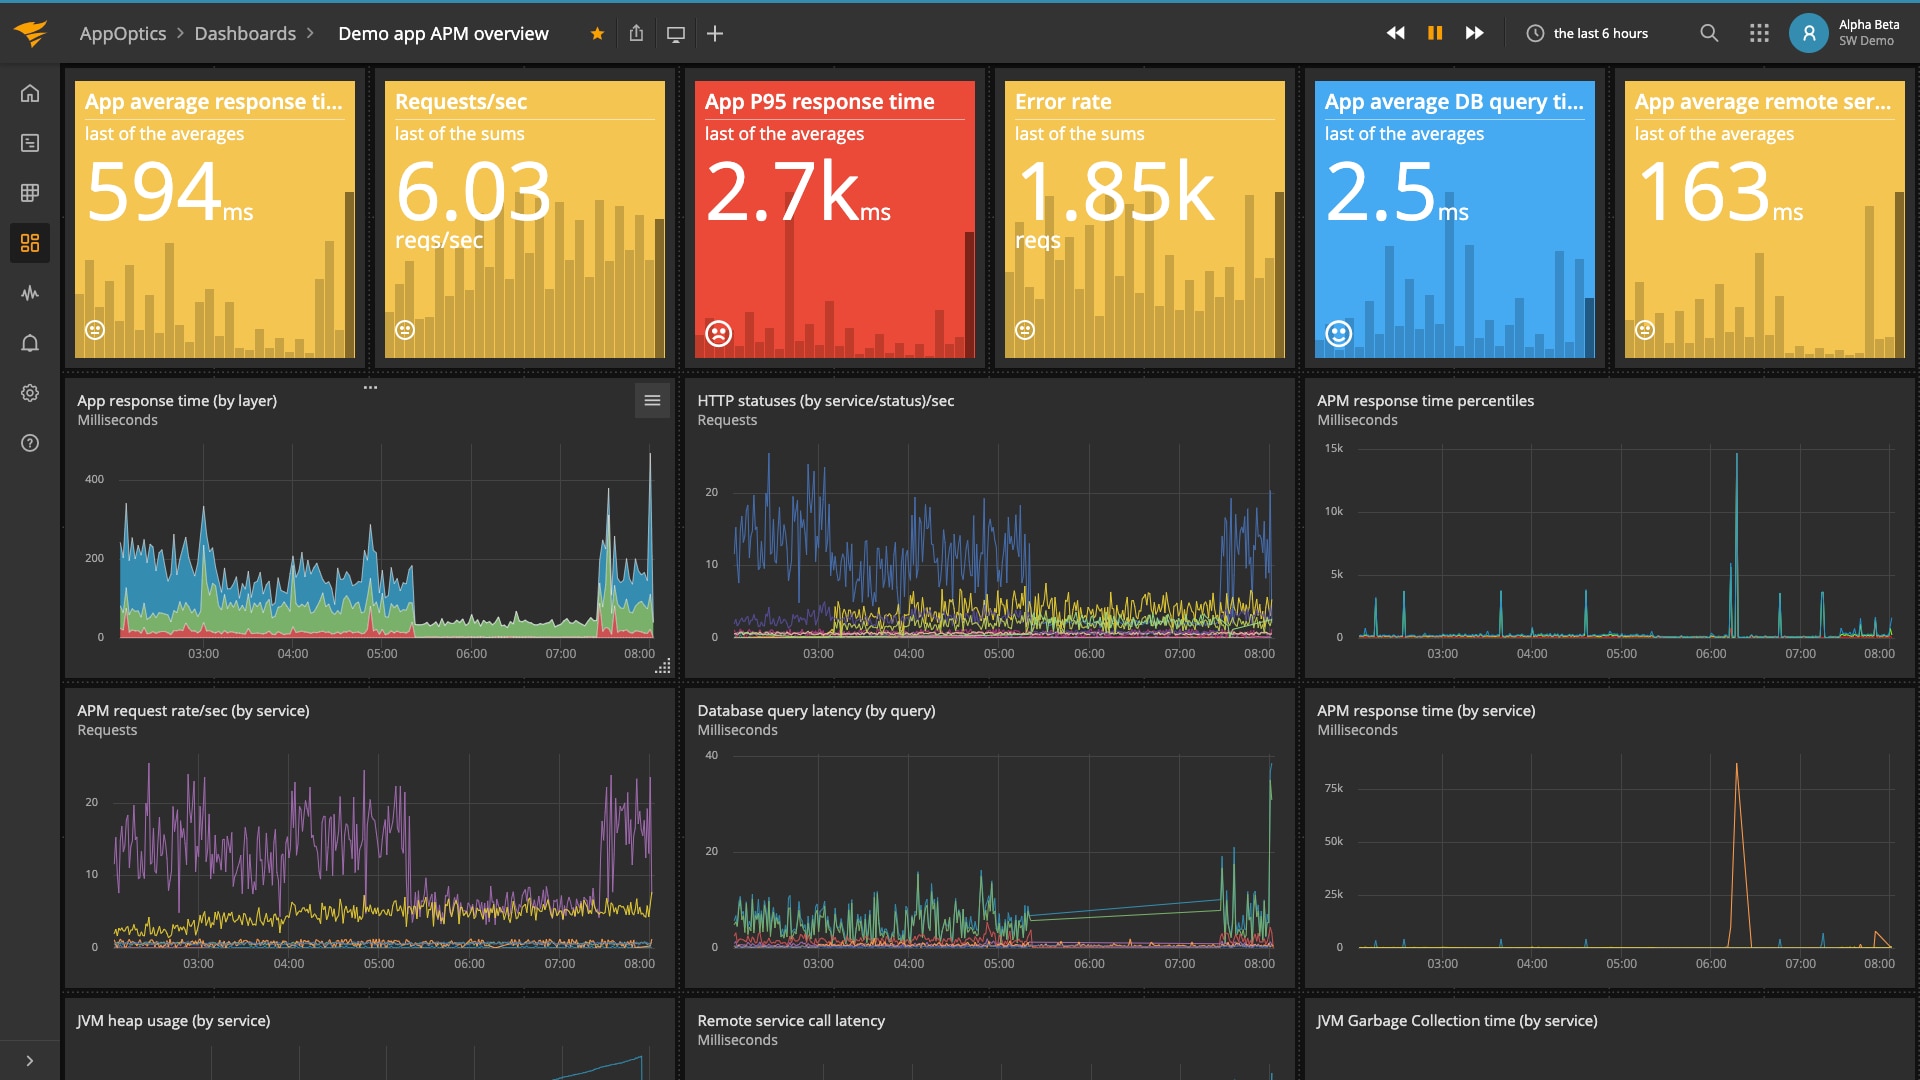
AppOptics overview dashboard. © 2020 SolarWinds, Inc. All rights reserved.
Then you can drill into specifics. AppOptics gives you a clear picture of application dependencies, allowing you to easily see how microservices are connected, what the database is returning to users, what functions are being called by the API gateway, and more. Additionally, by combining AppOptics with SolarWinds Loggly®, you won’t be overwhelmed by masses of logs. With one click, you can move from infrastructure hosts or your transaction traces to the relevant log events associated with a host or services making up a transaction trace.

You can also see your servers’ capacities and performance, and conduct trend analysis by comparing usage, capacity, and performance over time.

And importantly, with AppOptics you can monitor all your applications, without sacrifice.
Conclusion
Don’t compromise your monitoring. Look for an APM that you can afford to monitor all the metrics of all your business-critical applications, orchestration tools, and cloud platforms, all in one simple, elegant, easy-to-use view.
SolarWinds AppOptics is a new breed of APM that’s simple, scalable, and most of all affordable. To try it out, sign up for a free 30-day trial today.