
Your website performance is critical for success. Poor page load times and responsiveness can lead to lost sales, lost ranking on search engines like Google, frustrated customers, and more. Even beyond that, inefficient code can increase infrastructure costs and potentially even affect the ability of your business to scale. We’ll discuss how to run high(er) performance Python for web applications using the popular Django framework. We’ll cover some of the common problems and patterns so you know what to look for. We will also highlight the value of using Python performance profiling tools to help you see what potential improvement areas you might have.
Why Is Performance Important?
For many years the predominant measure of success in application development was the correct behavior of functionality, i.e., does my application do what it is supposed to do?
Performance was considered a non-functional requirement. From an end user’s perspective, performance almost always meant responsiveness. Does the application do what I ask it to do in a prompt and efficient manner? I believe performance boils down to two principal reasons:
Impact on the User Experience
Page load time is so critical to the user experience, 40% of users leave a site that doesn’t load within three seconds. With short attention spans, it’s critical your users don’t have to wait for pages to load, records to save, or for calculations to be made.
Decreased Cost of IT Infrastructure
The more inefficiently your code runs, the more infrastructure you need to support it for more users. Decrease the cost of your IT infrastructure by writing code to take advantage of your available resources while still providing the same or higher level of experience to your users.
You Can’t Improve What You Don’t Measure
Performance improvement is a series of quantitative measurements and adjustments. You need to use performance data to determine where to focus your effort. There are many metrics including network usage, memory consumption, CPU utilization, database performance, and so on. The most important metric to optimize for is response time.
Response Time
In server-side web applications, like those written in Django, this measure is typically the average response time; that is, the average time it takes for a request to go to your web application server and be returned with a valid response. This typically includes network call overhead. It doesn’t include things like page load time, which is a separate metric determining how long it takes for the page to actually render on the client’s screen.

AppOptics
In the wild, when your application is deployed, you need ongoing telemetry to identify long-running queries and functions. Application Performance Monitoring (APM) tools like SolarWinds® AppOptics™ give you a simple and easy interface to use in order to be able to search this data, analyze spikes in traffic or response time, and get a sense of the overall health of your application at any time. Functions like distributed trace combined with code profiling enable you to find a slow service, and then a slow function that only occurred in the real world. We’ll work through some examples later in this article using AppOptics.
Create a Real-Life Analog As You Code
One of the most important things I think about when solving a problem in code is how I would do this if there was no code. When we write code, we tend to forget operations have a cost, even if writing a few lines of code to solve a problem does indeed solve it. If we create a real-life analog of that operation, we can easily discover it isn’t very efficient.
Let’s take an example of the famous N+1 query problem:
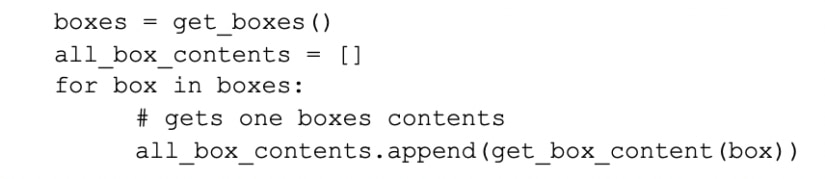
Looks good, right? Not really. Imagine for a minute your boxes and box contents are stored separately, as they would be in a normalized database. This is horribly inefficient, as you will have to make N queries to get all the contents of your box.
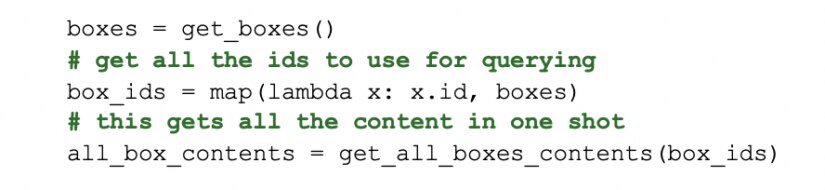
Imagine in the real-life analog that your database was a house with a bunch of rooms for tables. You’d have to walk back and forth between your rooms potentially thousands of times to fulfill your request. Wouldn’t it be much smarter to simply make one trip?
A better way to do this is:
Common Problems and Optimizations
Read below for some common problems and fixes to keep your code running optimally. While you read, if you’d like code references or the sample project I used for this post, please see: https://github.com/zpappa/python-perf-demo. If you follow the directions in the README.md you can start up a simple Django web application accessible via http://localhost:8000/demo. There are links from the home page to the various routes we used in the examples below.
1) It takes too long to enrich my data and return my results!
A common problem many developers face is when they have a list of records from one system and a list of records from another. They need to combine the results or perform some lookups in a meaningful way to enrich the data, so they can provide it to their users. Remember, if it takes too long to process your data because of a poor-performing function, your response time will be affected.
Let’s take an example of pairing Bitcoin balances from another website.
You want to combine the balances from this website from your user list and provide your end user with a page showing your information tied with the user’s Bitcoin balance.
For the sake of the example, let’s make some assumptions and pretend you don’t have an integration automatically populating these records into a table, which then allows you to join them.
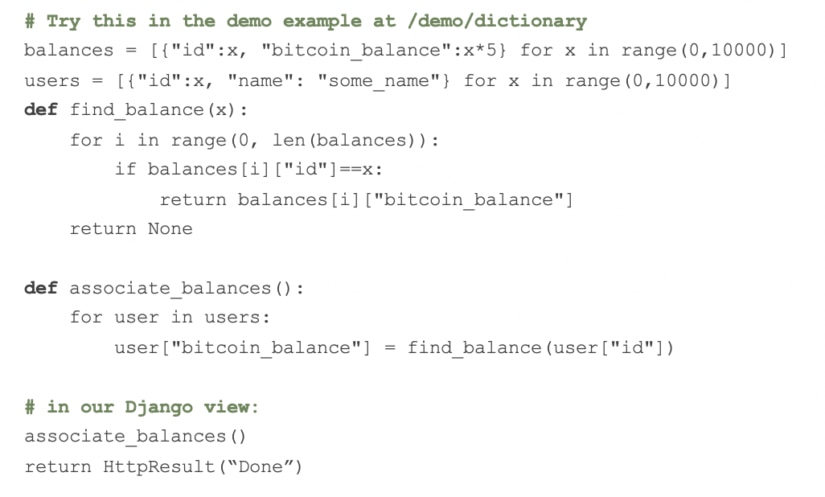
Let’s assume you have two lists: one of balances, and one of users on your website:
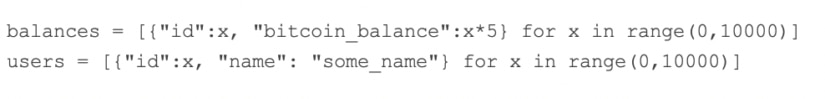
Iterating through the list of users to pair with the balances can be costly, especially if you consider the math:

For our example of 10,000 records in each list, this means potentially 100,000,000 iterations!
Use Dictionaries, Not Lists for Lookups
If you’re performing a lookup operation against a data set more than once, it generally makes sense to convert it to a dictionary so you can search by key. Remember the access time for any record in a list is O(N), versus the access time in a dictionary can vary from O(1) to O(N).
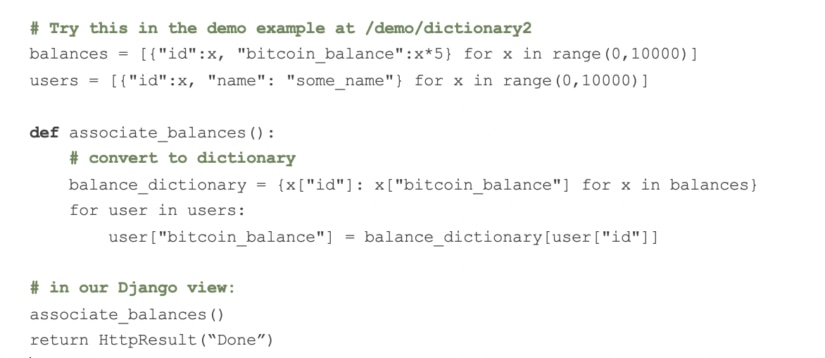
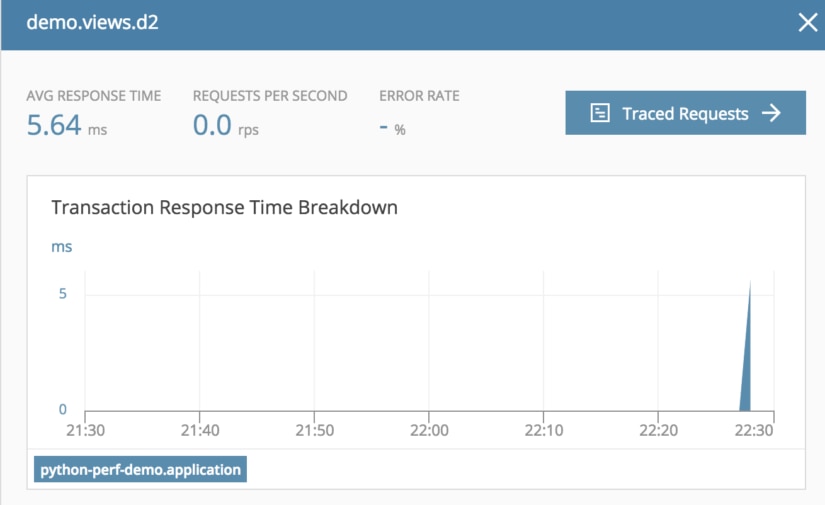
Building off of the Bitcoin example shown above, we’ll create a Django view and use AppOptics to time each request.
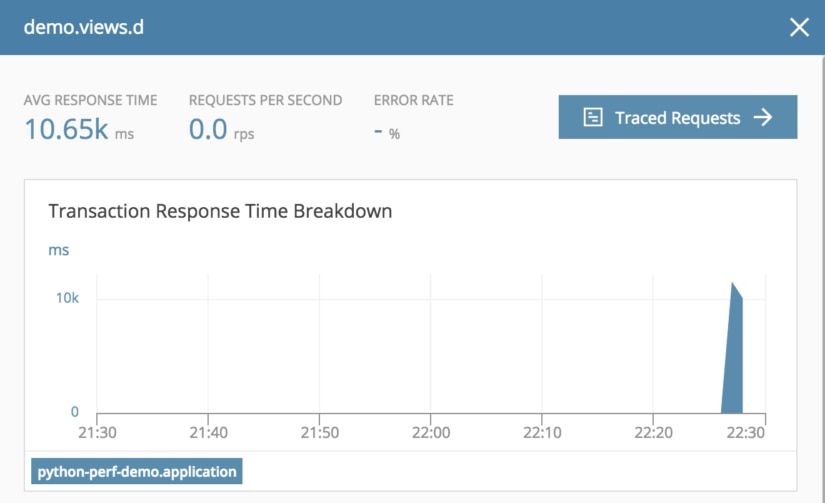
In this version of the code, we converted the list of balances into a dictionary, where the key in the dictionary is the ID of the record.
Then we iterate over the user list and perform dictionary lookups to find the associated balances. This reduces the response time because the access time for the lookup is reduced by converting it to a dictionary.
Note: In a real-world example, you likely won’t convert this to a dictionary in every function call unless the underlying data is changing. However, I included the conversion in the method call to provide a complete example including the time it takes to convert it.
One of the really nice things about AppOptics is its ability to provide the data on your performance in real time and with visual aids.
This is also ongoing, so you can discover application issues as they occur, and deal with problems before they become too large.
Another feature I really appreciate is your history is stored, so you don’t have to save your timing results off somewhere; you can simply go through their UI and view it.
2) It takes too long to calculate results!
Another common problem developers run into is the need to perform long-running computations. Say you have a table you pull from a database with some numbers in it. You need to perform calculations against those numbers and then return the result set. This could take a significant amount of time when dealing with many rows.
In the below example, we are iterating through our list of balances and calculating each user’s next likely balance as a cumulative measure of the amount of change from their previous balance to their current balance. This is a simplistic example that is probably a terrible prediction in the real world but a good example of how I have seen people run calculations against lists of data in Python.
Here’s the mathematical formula we are using to determine the next likely balance:
n = c + |c-p|
Where n is the new balance, c is the current balance and p is the previous balance.
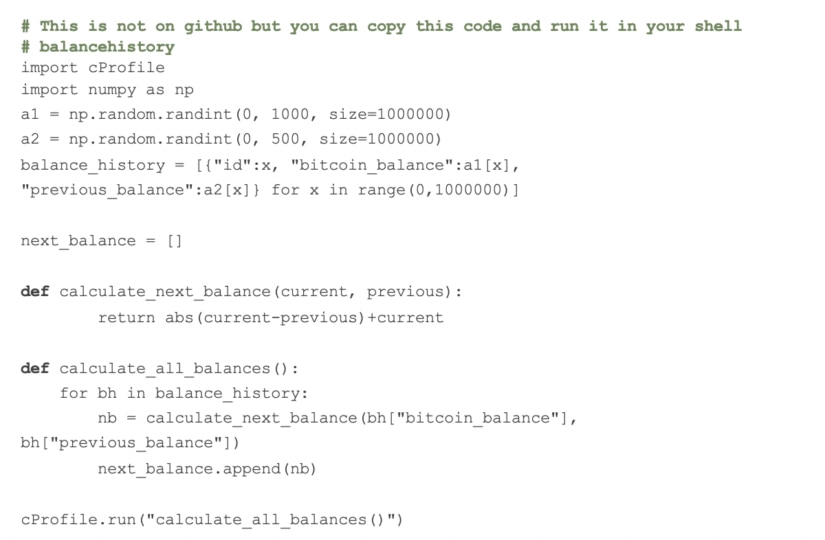
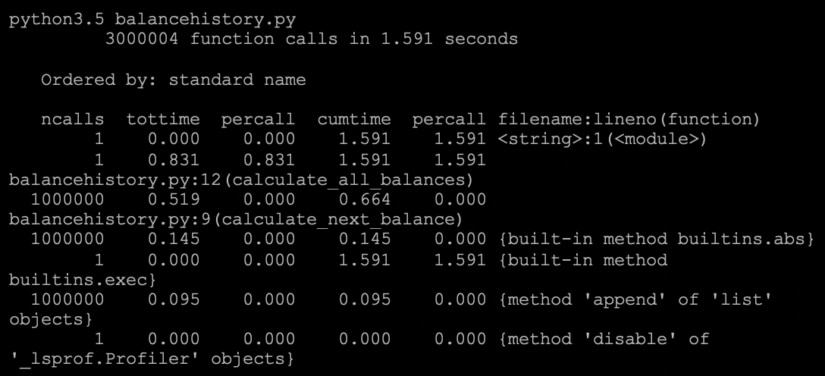
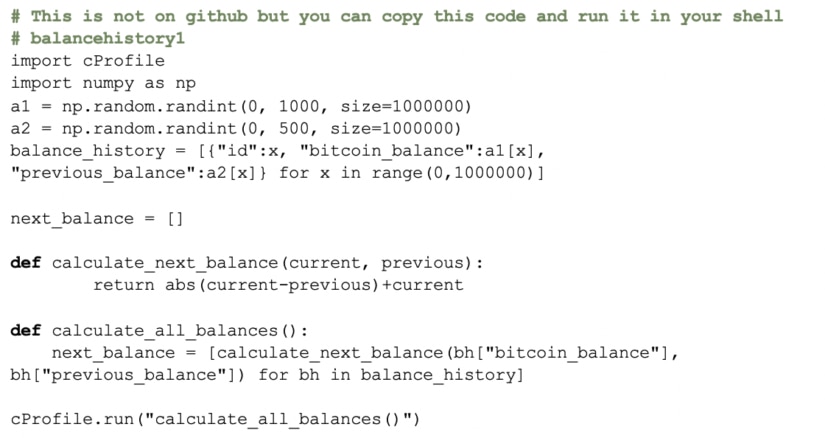
Use List Comprehension
List comprehension is a language feature in Python allowing you to create lists from other iterables. It’s an optimization in the compiler, which means that the compiler recognizes it as a loop faster; thus, using list comprehension can often speed up your result processing. It’s also cleaner-looking code.
You should consider using list comprehension when you have to build a list using append, as list comprehension saves the time spent looking up the list and running append on every iteration of your for loop.
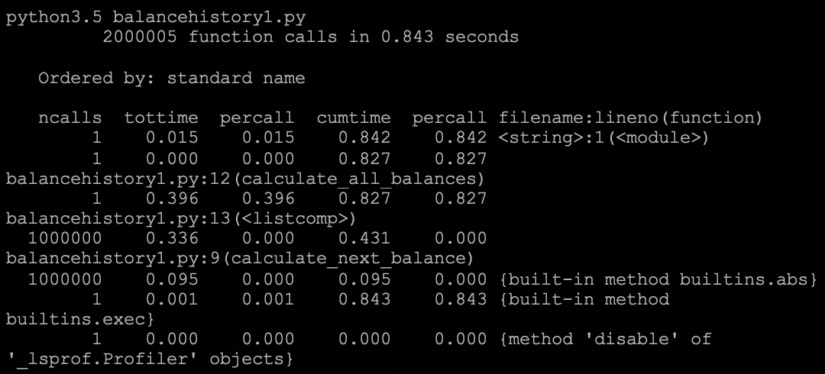
See the example below using list comprehension and its timings.
3) Loading from the database is too slow
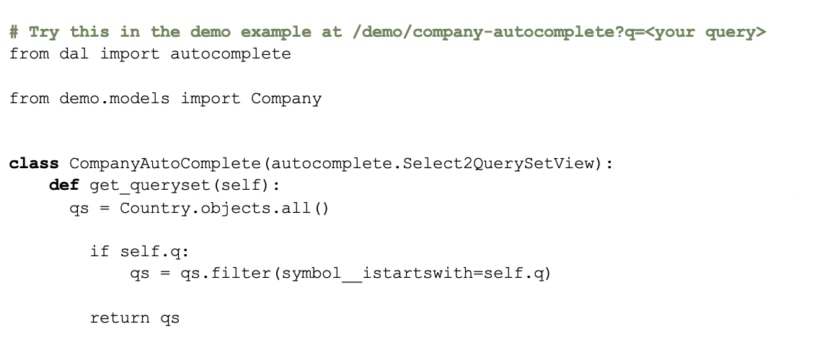
In this all-too-common example, a Django view is surfacing records from a collection with possibly thousands of values for an autocomplete field.
This can be a potentially slow interaction, depending on the complexity of the object, the number of potential values, and the number of queries being made by an average user.
Imagine on the small end, 100 users all typing in at the same time. This could potentially result in thousands of queries being made against your database all at once.
To recall using the analog of a real-life example, imagine going back and forth to your database “room” for the same data at nearly the same time. Wouldn’t you rather keep a copy of it so you didn’t have to walk back and forth?
I chose to use the popular django-autocomplete-light module for this example.
The field in question for this code example is tied to a database call to return matching stock ticker symbols for a company. I went ahead and preloaded the SQLlite database this example ships with, with approximately 3,000 choices from NYSE’s publicly available list of companies.
Cache Your Results
The most obvious choice to speed up these interactions is to cache the function results for these queries so we can reduce the number of round trips we have to make to the database. Django already implements some level of queryset caching based on the way the Django ORM works. However, if we cache at the function level intelligently, we can still speed up results, and significantly in certain cases.
Not every user will be able to benefit from these immediately, but as the cache increases through use, so will the roundtrip time for successive calls.
You have two common options here when using Django:
- @lru_cache option (Python 3.3 or higher) to cache results from your function calls. This is included in the Python function library.
- @cached_property decorator provided by Django.
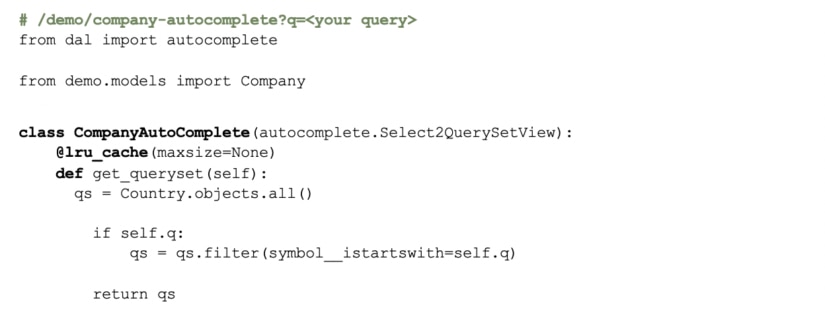
I decided to do this example with @lru_cache. Here is the code before and the timings of a query.
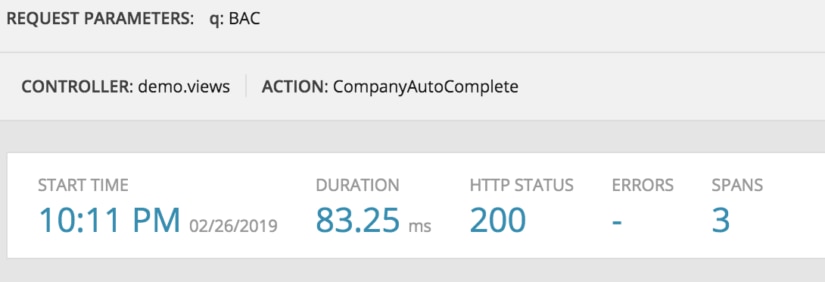
Versus
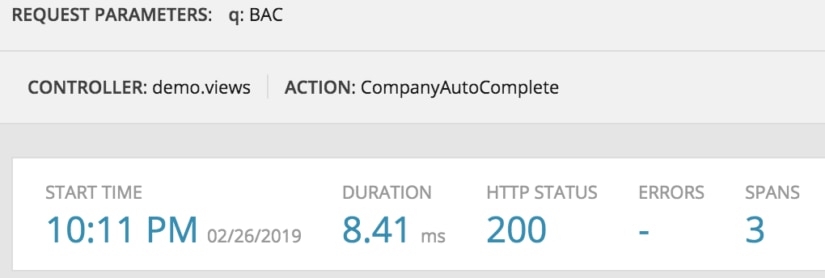
Here is the code with @lru_cache on our get_queryset method and its timings. As you can see, we’ve improved performance nearly 10x by caching our results.
4) Improving performance of the Django ORM
Typically, this isn’t a problem you run into in simplistic data models using Django, but as your application starts to get more and more complex, the “easiness” of using Django’s ORM can lead to performance bottlenecks.
One of the best reads on this topic is from Kyle Hanson of Carta. I recap some of his insights below and add my own input.
Use prefetch_related and select_related
When you know you have to access foreign object relationships on an object, prefetch and select related can greatly speed up access time by making one database call as opposed to potentially hundreds.
Get Only What You Need
Use values and values_list on querysets to pull out only the values you need from objects. This can reduce the time it takes to get the data you need. Here’s a simplistic example using APM to monitor once again.
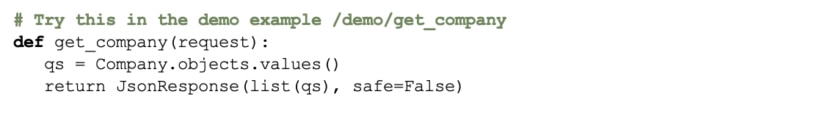
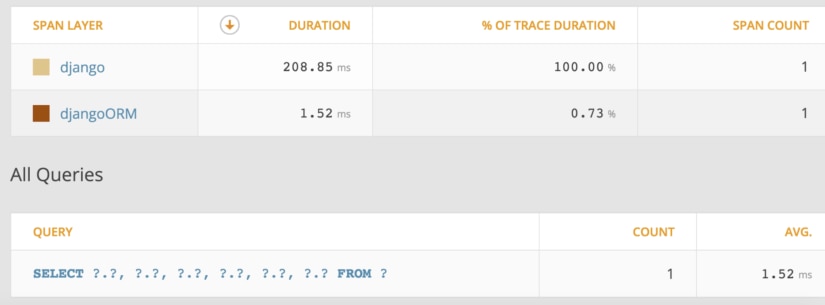
Versus
In this example, we actually define the column fields we want. As you can see in the APM query section below, the resulting query and response time is much faster.
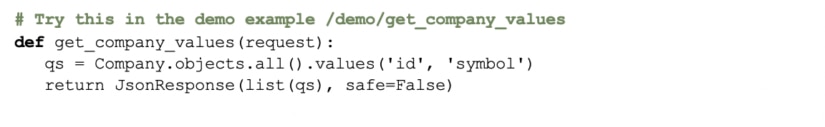
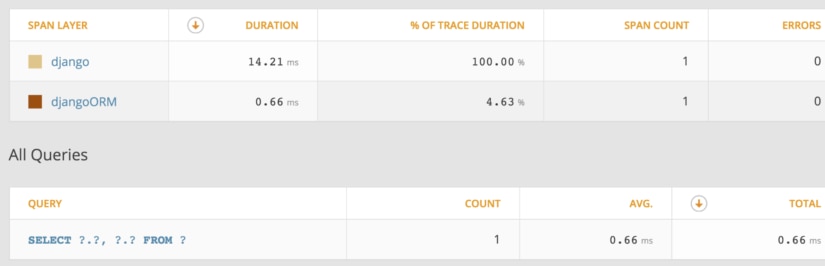
Use Telemetry to Detect Unnecessary Queries
As you can see in the above example, the APM integration with Python and Django provides a full view of all the queries you make when accessing a view. This is extremely helpful with diagnosing if you have any queries being made that you may not need, which is a common problem when you use any ORM.
APM is also extremely helpful in understanding the performance cost associated with each query, as it provides a breakdown for you without forcing you to time them individually.
5) Handling Slow Transactions
Handling blocking code, or code that runs for a significant period of time thereby blocking other user requests from being served, is a common problem in any web application environment. Django offers integration with celery to farm out tasks to celery workers.
This allows your web request to continue and send a response back to the user (thereby freeing up the ability to respond to more requests).

There are other good options beyond celery, but I recommend celery to folks as it is an established product with tons of documentation, can backplane with Redis or RabbitMQ, and has seamless integration with Django.
Ultimately you’ll have to determine what classifies as a long-running task and what doesn’t. Some common examples are report generation, video, or image processing. In order to provide low response times to your users and maximize the number of users you can support on your infrastructure you should be using some non-blocking mechanism such as celery or some variant thereof to complete these tasks.
Vitor Freitas has written a pretty extensive article on this that you can check out if you want to know more about how to use celery with Django.
6) Don’t Forget, Memory Is Important.
Although this article is mostly concerned with processing time, it’s critical to note memory usage is an extremely important consideration. Profiling can help you determine whether or not your program is more in need of memory than time management. The reasons and ways to do that are too many to list, but many of you have probably seen this common error.

Here are a few simple reasons that cover a surprising number of cases, and can help you write better code to manage your memory better.
Upgrade Your Python Distribution:
Usually, the simplest is that you’re running a 32-bit distribution of Python and reached a 2GB memory limit. Upgrade to a 64-bit distribution and hopefully, you won’t have the same issue.
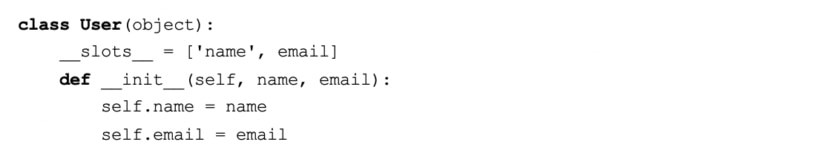
Use Slots
Memory can be reduced by as much as 40% if you use slots for predefined attributes on your classes. If we didn’t use __slots__ as per the below snippet, name and email would be added to a __dict__ object as well on the class, unnecessarily increasing memory consumption.
So, if you know you these are fixed attributes, save your available memory and use slots.
Use Generators to Build Large Result Sets
A generator is simply a function with the yield keyword instead of return.
Since a generator is just syntactic sugar for an Iterator, results are computed when you ask for them instead of when you initiate them. This is also known as lazy loading.
In a typical function, when you return a value, the stack frame for that function is destroyed. In a generator when you yield a value, the stack frame is saved and can be reused when the variable to that generator instance is called again.
What this means is if you use generators, you don’t need to create all of your list elements ahead of time. You can simply create the function that creates those elements. Then, the requirements on your memory consumption are much lighter because your giant list doesn’t have to live in memory.
It’s important to note that the usage of the yield keyword in your function dictates whether or not a function is a generator in this case. It can also dictate whether or not a function is a coroutine. Generally speaking, generators produce data and coroutines (in Python) consume data. Here’s a great explanation of coroutines in Python if you’re interested.
Using this in practice, let’s create a generator to arbitrarily define some dictionaries for us.

Don’t Concat Strings
Like most languages with their own garbage collection, strings are immutable in Python. What you’re actually doing when you do this…

…is setting two completely different strings, one of which has to be garbage collected.
The right way to do it is…

7) Intuition isn’t always right
We’ve gone through a few examples at this point. I think it’s pretty clear metrics are required for improvement, but if it’s still not, read on for this example.
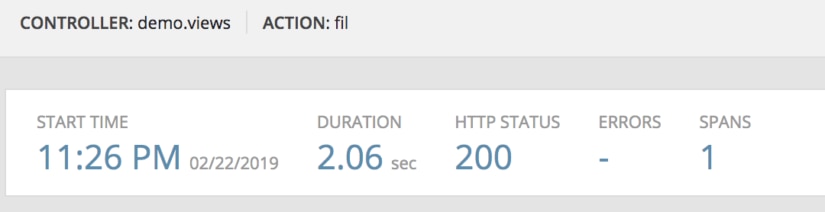
One of the simplest problems is just finding a value in your list. Many people think Python’s built-in functions are far superior to using for loops. Let’s put that to the test with another AppOptics example.
Here’s a code example of a for loop:

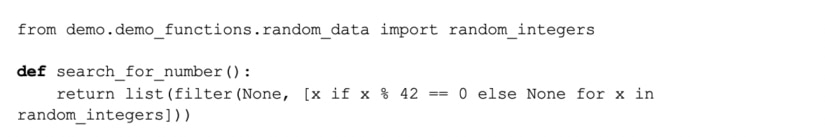
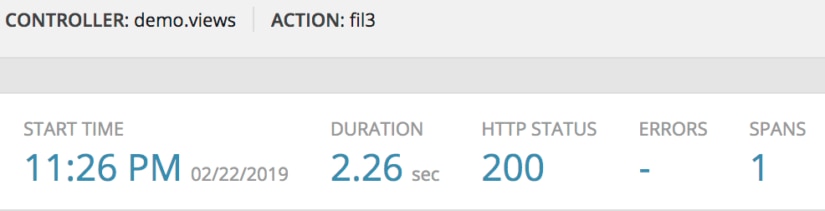
Here’s a code sample of a filter with a lambda:
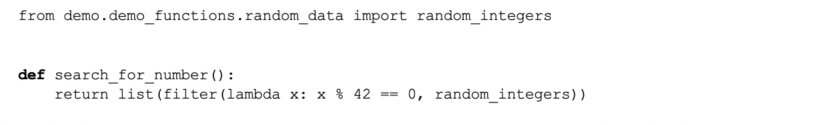
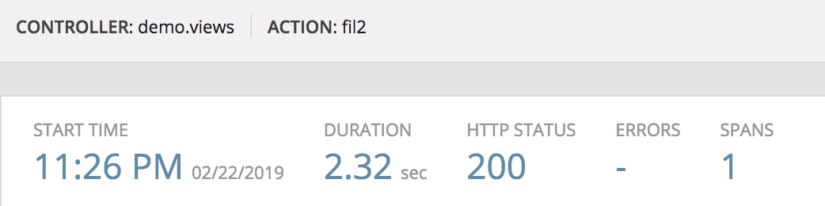
Hope you were paying attention! As you can see, the cost of setting up all those stack frames with a lambda function actually outweighs the cost of simply doing a loop, To tie the example together with the previous ones, here is a list comprehension example of this solution and its timings.
This is Why We Measure
Surprised? Common Python wisdom says list comprehensions are faster than for loops, and maybe they are at generating a list. However, in this particular case for this particular problem with these solutions, they’re not.
As a professional developer, knowing how to use tools like AppOptics will help you from falling into these kinds of pitfalls and keep your code running well.
Tying It All Together
By now you’re hopefully a bit better educated on some of the common performance problems with Python and how you can use tools like AppOptics with distributed trace and code profiling to help diagnose your problems.
To start profiling your applications today, sign up for a free 14 day AppOptics trial and install the Python APM agent.