In a world where customers left waiting for a page to load will often bounce to other sites, PHP performance is essential. This can affect your revenue directly if you lose purchases, and even lower your SEO ranking and ability to attract new leads. I’m going to explore common pain points in web application performance and how you can use application performance monitoring (APM) to find and resolve them. We’ll run through common SQL and application performance problems in Laravel applications, and how to optimize them using techniques like eager loading and several types of caching.
Donald Knuth, author of The Art of Computer Programming, once said that premature optimization is the root of all evil. Attempting to predict how and where your application will be slow in the future can get in the way of solving problems in the present for your customers.
On the flip side, there comes a point where your application performance has to be optimized. This usually happens when you stumble onto a performance issue yourself, hear customer complaints, or something breaks. You debug the code, add timers to log files so you can measure performance, and fix the issue. Great! That is, until the next time. Timers and log files can get old and unwieldy very fast, but there is a better way!
SQL Performance
Relationship Expansion, Performance Contraction (N+1)
One of the great features provided by Laravel is Eloquent, a built-in object-relational mapping library (ORM). Eloquent is easy to use, but the catch is that it uses lazy loading when accessing related tables. As your application grows your schema will also grow with it. Additionally, for each relationship you add to your schema (and that you forget to eager load when you can) your performance will suffer. (This is the N+1 part.) This can cause significant delays, especially if your data is highly relational.
An APM tool can profile your database queries and display their execution time, helping you to find slow or excessive queries. We are using SolarWinds® AppOptics™ to demonstrate this and other optimization capabilities in the article.
The following diagram shows a simple database schema for storing blog posts.

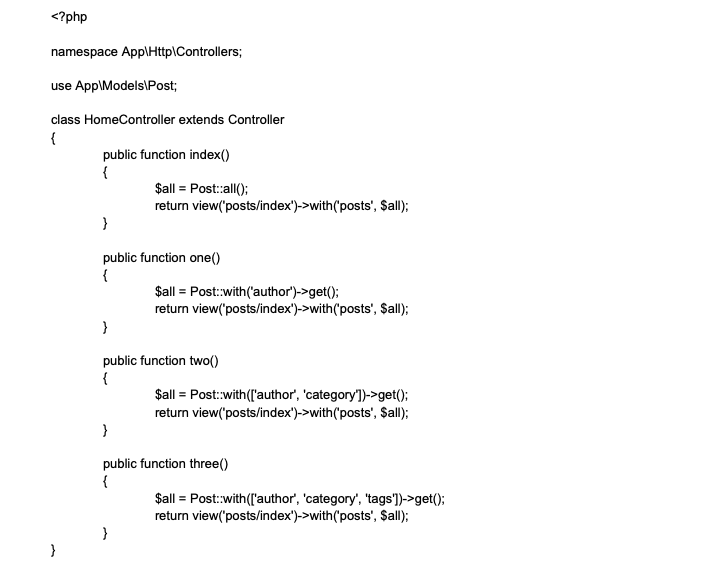
To demonstrate the effects added relationships have on performance, I have created a super simple controller containing methods that retrieve data about each post’s author, category, and tags. Each additional data point adds another join to the query.
If you look at the methods in order (index, one, two, and three) you can see that for each increment I am adding another relationship to be loaded eagerly. The difference is in using Post::with() instead of Post::all(). You can pass a single relationship as a string or multiple relationships as an array. For more information, please have a look at the Laravel Documentation.
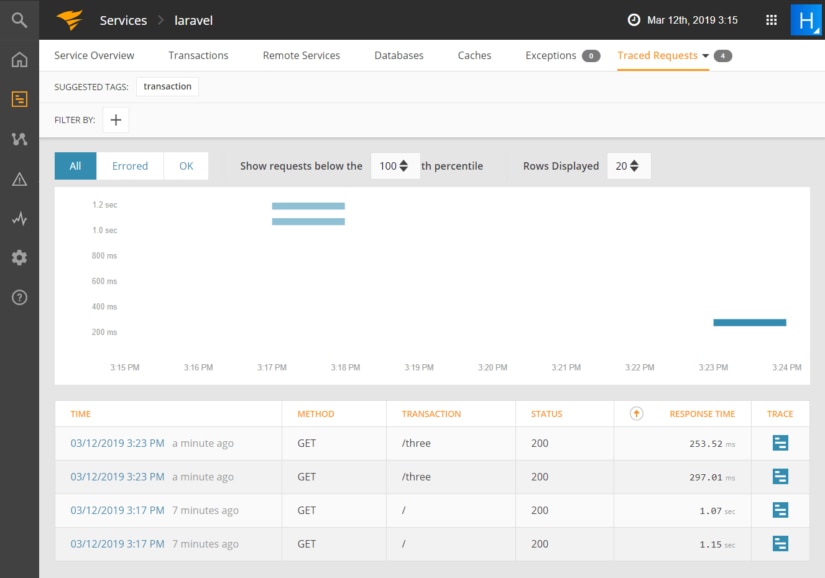
As you can see from the AppOptics overview, going from no eager loading at all, to eager loading the related tables, have cut our response time from roughly 800 milliseconds to somewhere in the 250-millisecond range! Not bad considering how little work this involved.
Eloquent Model Caching
Adding model caching to your Laravel application can provide a huge boost. This works by putting a cache layer in between your Eloquent models and your database. When a model loads a record it adds a copy to cache (Redis in our example). When a model is saved it invalidates the cache, so your application is using data that is current. There is also a method for setting a cache expiration time which can be useful for tweaking applications under heavy production load.
Using laravel-model-caching from GeneaLabs makes this incredibly simple and easy. The latest version requires Laravel 5.8. So if you’re using version 5.7, you will need to use the 0.4.0 release. Installation requires two composer packages:

Add two lines of code to each class you wish to make cacheable. Caching is added using PHP’s Trait syntax. You can find more information about Traits here.

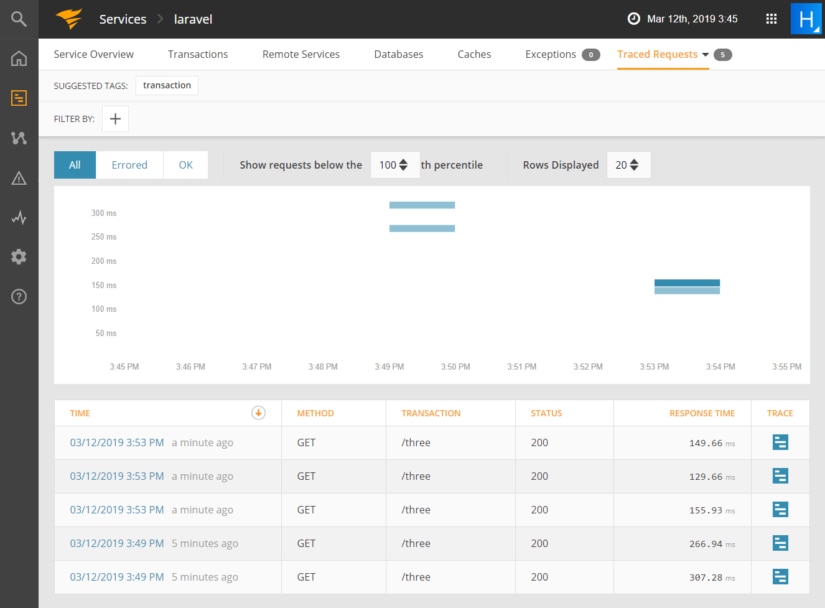
The following graph from AppOptics shows that by enabling caching for the Author, Category, Post, and Tag models, we have increased performance from the 250 millisecond range to roughly 140 milliseconds.
Application Performance
Page Output Caching
Given enough traffic, nearly any dynamically rendered page can give your server heartburn. The more unwieldy a page is, the longer it takes to render, and the longer it takes to reach your users. For example, Monica is a CRM for storing personal relationship data such as contacts, reminders, and tasks. To stress test Monica, we added 3,854 contacts and 182 tags and tried loading the contact list page.
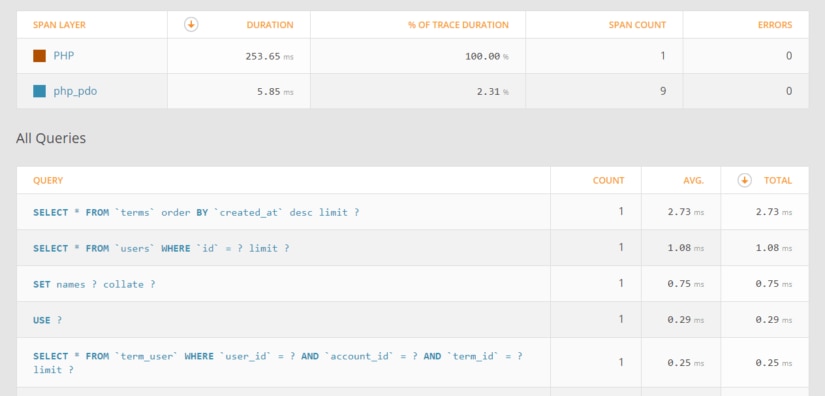
The trace breakdown gives us a general idea of where the bottleneck is located. As we can see, despite the number of queries being executed, most of the execution time is on the PHP side. That means SQL optimizations will not help in this case. Instead, we need to cache the rendered page.
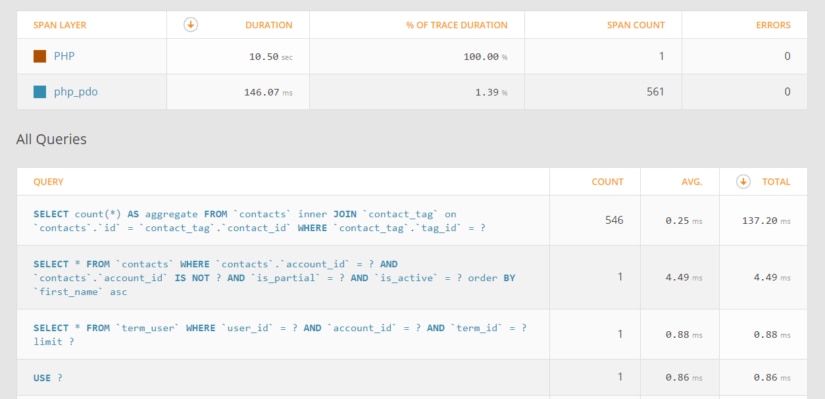
Adding output caching to this page using Redis reduced render time from 10.50 seconds to 253 milliseconds!
For this simple example, it took just eight lines of changes:
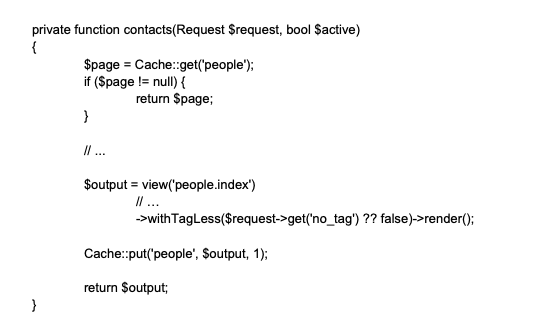
For a full production implementation, you would need to vary the cache key based on more information from the HTTP request (i.e., query string, post, and session ID). You might also schedule a job to refresh the cached page with a new version before it expires.
Laravel Route and Config Caching
The gains you will see in your Laravel application from route and config caching depend on your application size. As more routes are defined and your configuration grows you will see more benefits. These two performance tweaks will not help very much on their own, but when combined, they can give your application a good boost.
Caching your configuration and routes is easy. These two commands will generate cache files in your application’s bootstrap/cache directory so that they won’t need to be parsed on every request.

Be sure to remember to rerun each of these commands after you change or deploy your code.
PHP OPCache Extension
The OPCache extension is enabled by default when you install PHP on Ubuntu 18.04 for both Apache (mod-php) and FPM. PHP is a scripting language that has to be compiled each time it runs. OPCache works by storing the compiled output of your PHP scripts in the server’s memory the first time they run. This saves time on each subsequent run since your code is now precompiled. It can give your applications a great boost.
I ran some tests using both Monica and our simple blog application. The blog post list that uses full eager loading took an average of 267 milliseconds with OPCache disabled. Turning OPCache back on brought request time down to an average of 192 milliseconds. That’s a decrease of roughly 28%.
The numbers for the Monica application look even better. The contact profile page took an average of 303 milliseconds with OPCache disabled. Enabling OPCache reduced request time to 168 milliseconds. That’s a decrease of 44%.
Be sure to check your servers and make sure this extension is enabled in your own applications.
Conclusion
Performance optimization is an ongoing process in every production application’s lifetime. There are mainly two ways to go about this: proactive or reactive. All roads lead to Rome, but one road can help you to stay in front of issues while they are still small.
Application performance monitoring (APM) tools can help you keep your customers happy by allowing you to be proactive about identifying and addressing performance bottlenecks in applications. There are several key features that can help you accomplish this. SolarWinds AppOptics, in addition to APM and tracing, also features infrastructure monitoring, alerts, charts, and custom metrics which let you track your application to the limits of your imagination. It supports PHP 7.2 and will be updated as new versions are released. Learn how it can help you improve PHP performance.
If you are interested in learning more about AppOptics, use these links to learn more about AppOptics APM or start a free trial.


