What’s the most wanted feature for a Node.js application? Well, high performance with no downtime is one of the top answers for this question. But how do you accomplish this? Monitoring is key to gain a better understanding of the health of your application. For example, by implementing monitoring, you can detect problems, such as a memory leak or long-running processes that block the Node.js event loop.
This blog discusses why you should monitor your Node.js app, explores which app monitoring metrics matter most, and introduces three common problems you can solve through monitoring. Finally, we discuss different types of alerts you can implement for your Node.js application.
Why Monitoring Is Key for Improving Node.js App Health
Often, application monitoring is overlooked. However, it’s a crucial element for measuring the health and performance of your application. No application is perfect, and issues can arise for any application.
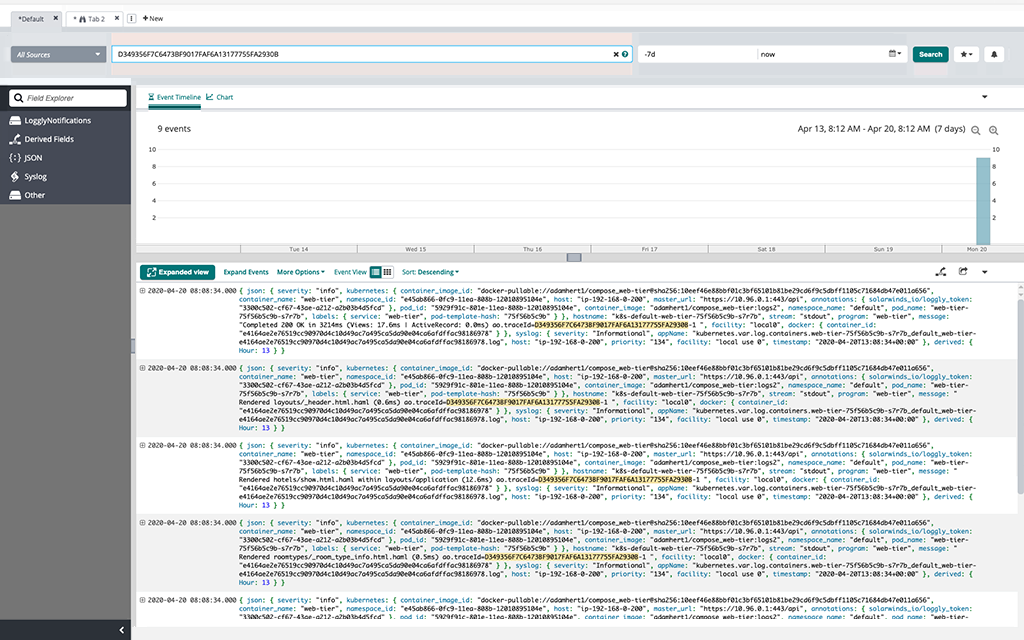
You can detect issues faster through monitoring. The most obvious issue is an application crash. However, it’s much harder to detect smaller issues that only occur once per day. Application monitoring helps you navigate this sea of logs and find small application issues.
Furthermore, monitoring allows your organization to shift from reactive monitoring to proactive monitoring. Through anomaly detection, you can detect patterns that may cause issues in the future.
For example, let’s say you detect a whole set of failed login attempts for one of your applications. Such a pattern might indicate a malicious person wants to gain unsolicited access to your server. Application monitoring enables you to detect these types of pattern-based issues.
Therefore, you can resolve potential problems before they even occur. Without monitoring, you are essentially waiting for an issue to arise, so you can investigate and solve it.
However, it takes much more time to resolve such an issue as you don’t have the context monitoring can provide you. In other words, you’ll have to search thousands of logs to find out what exactly happened. Developers can find the root cause of an issue much faster when implementing application monitoring.
Which Metrics to Measure and Why
Here’s a list of four important metrics you should measure to get better insights into the health of your application.
#1. HTTP Throughput
HTTP throughput tells you how many requests your application can handle. It’s an important metric for scaling your application. For example, when you notice the number of failed HTTP requests increases, your server can’t handle the number of requests. You should measure the HTTP throughput and determine your application’s upper limit through stress testing. This way, you can create rules to automatically scale your application based on the HTTP throughput.
#2. Average Request Response Time
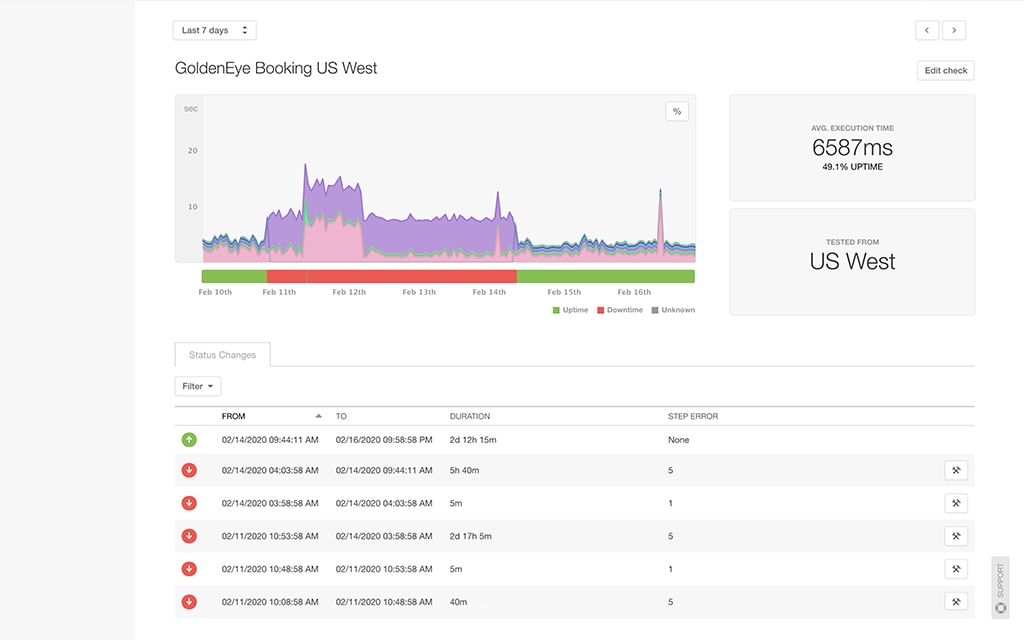
The average response time (ART) metric tells you how long it takes your app to respond to a given request. This metric contributes to the overall health and performance of your application. The lower your ART, the better!
However, bear in mind to also measure the edges. If you only measure the average response time, you might miss out on important information such as the longest response time, also referred to as “peak response time.” For example, you can create a metric to track each request that takes longer than three seconds to complete.
The ART metric alone might swallow slow requests. By measuring the slowest requests, you might detect memory leaks you otherwise wouldn’t. Moreover, it’s not a waste of time to investigate the slowest requests, so you can further enhance flows in your application.
#3. CPU Usage
Measuring CPU usage is a system-level performance metric. Other important system-level performance metrics include memory utilization and disk usage. The CPU utilization refers to the amount of CPU time your application requires to handle a request.
If you detect some requests use up to 50% or more of your CPU, you might want to investigate this. You might need more CPU capacity, or you might want to evaluate the code snippet causing the CPU spike. Perhaps incorrect coding causes your CPU usage to spike.
#4. Event Loop Time
Measuring the Node.js event loop time is the number one tip for developers to improve application performance. It’s one of the best metrics to detect bad code design. As Node.js uses a single thread, synchronous tasks block this thread.
Synchronous tasks aren’t necessarily bad; however, long-running operations prevent you from doing anything else. A blocked event loop is something you want to avoid—it increases the average response time for other requests, as they also have to wait for the event loop to be cleared again.
If you detect problems with your Node.js event loop time, first look at your code. Maybe you’ll find some long-running synchronous code. If not, you can try using a profiling tool to detect time-consuming Node.js tasks.
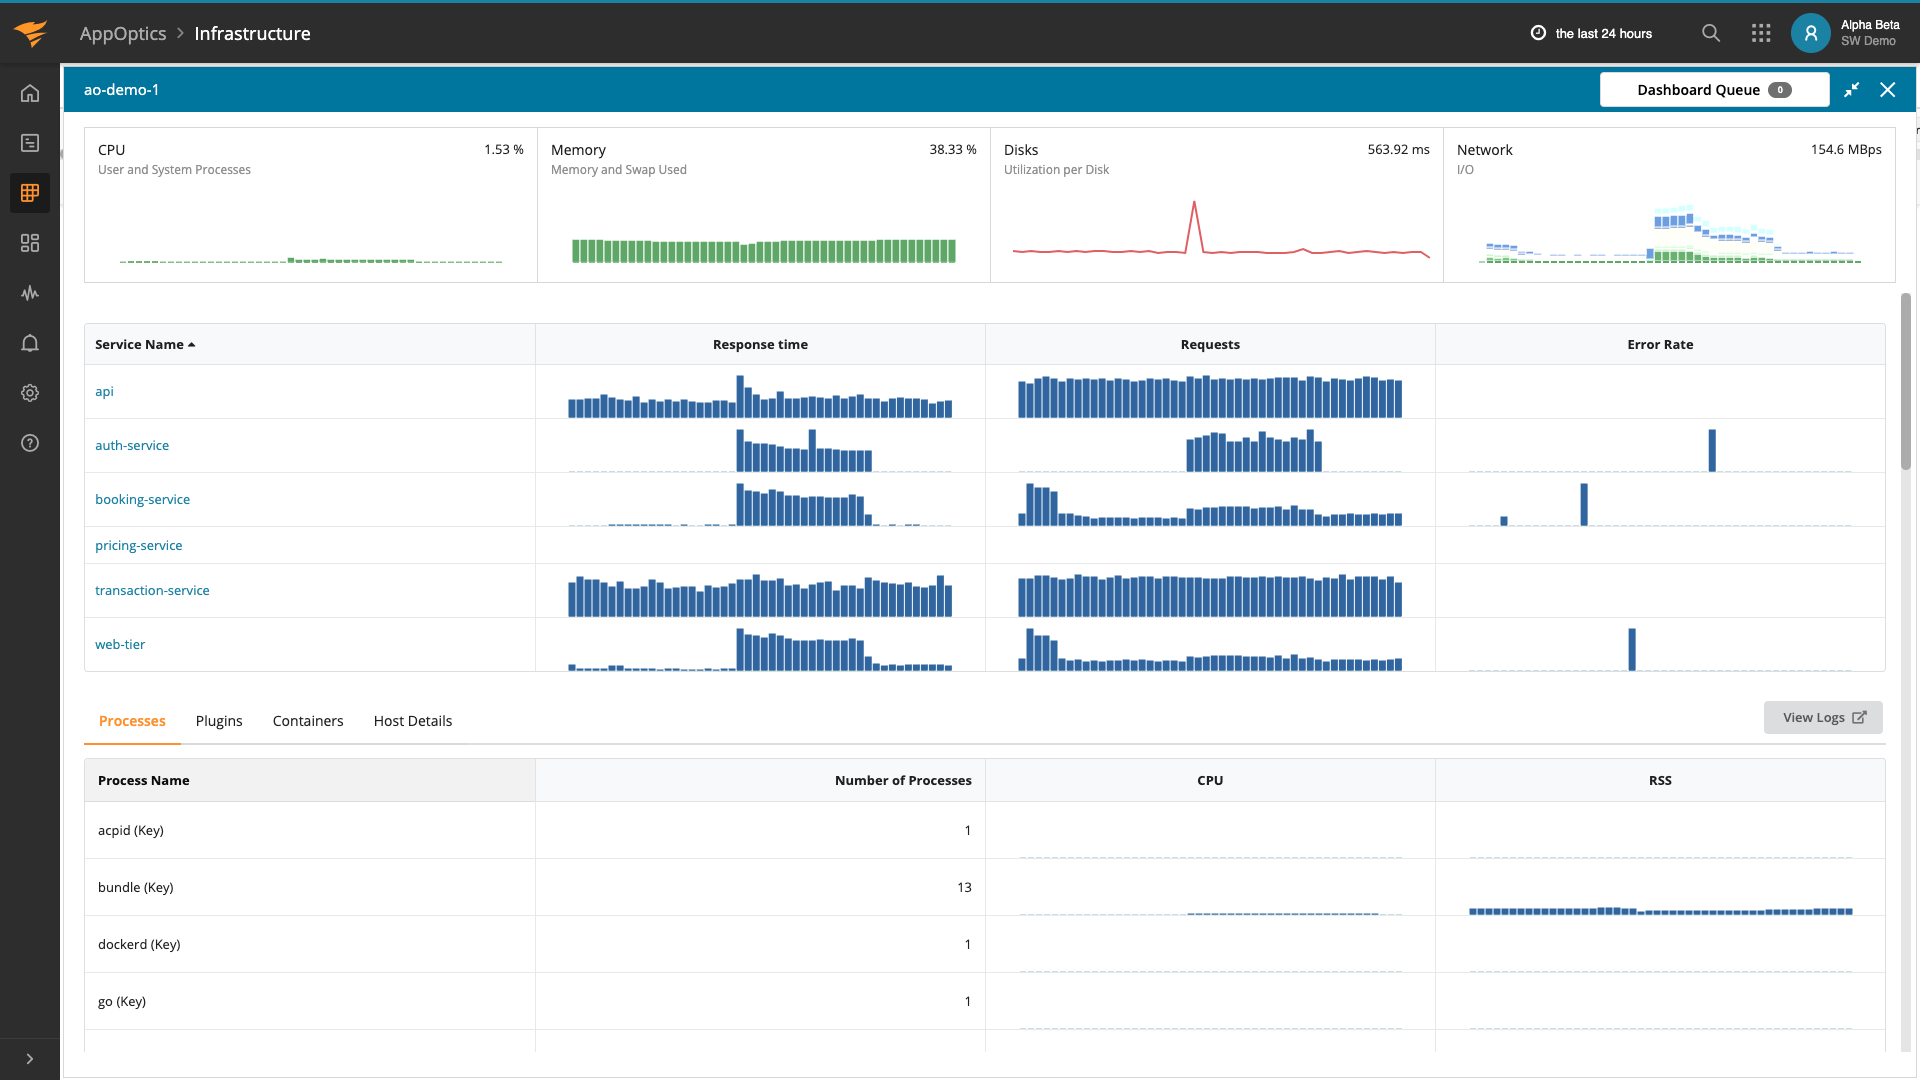
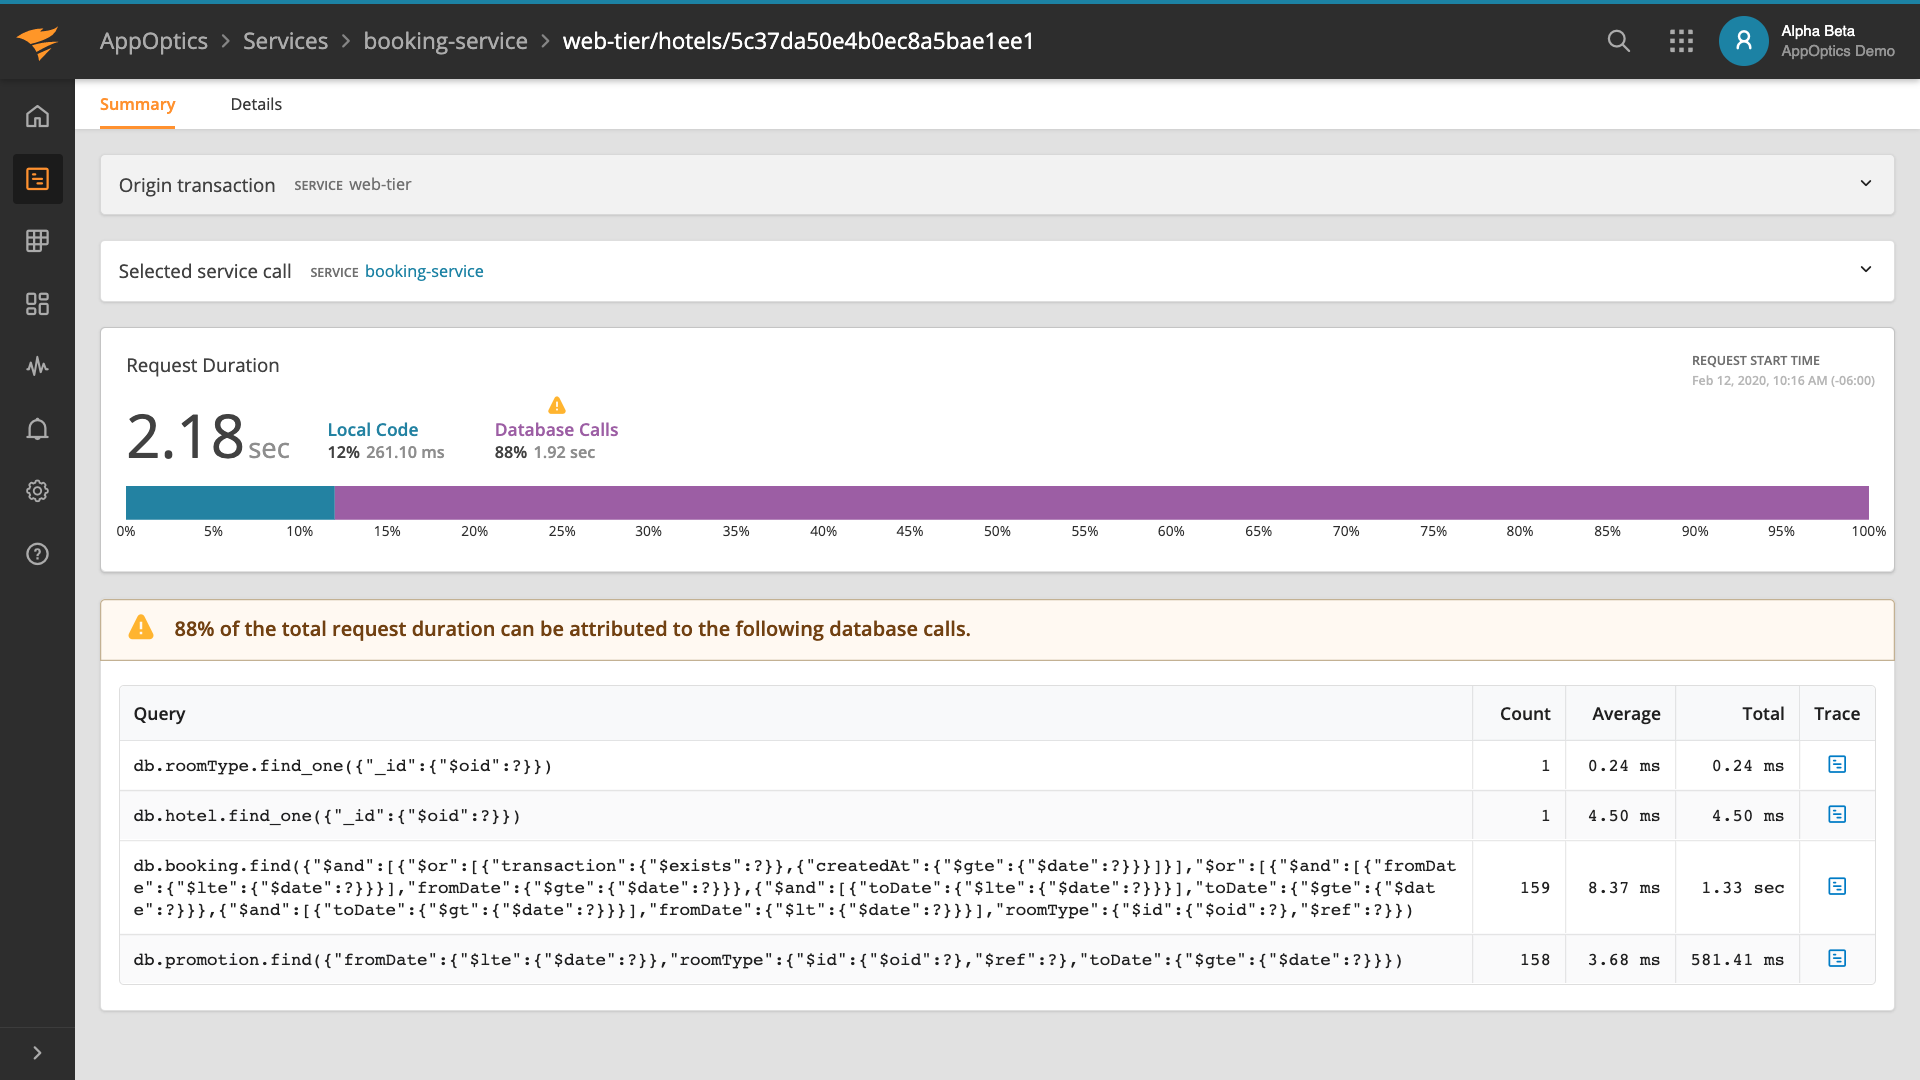
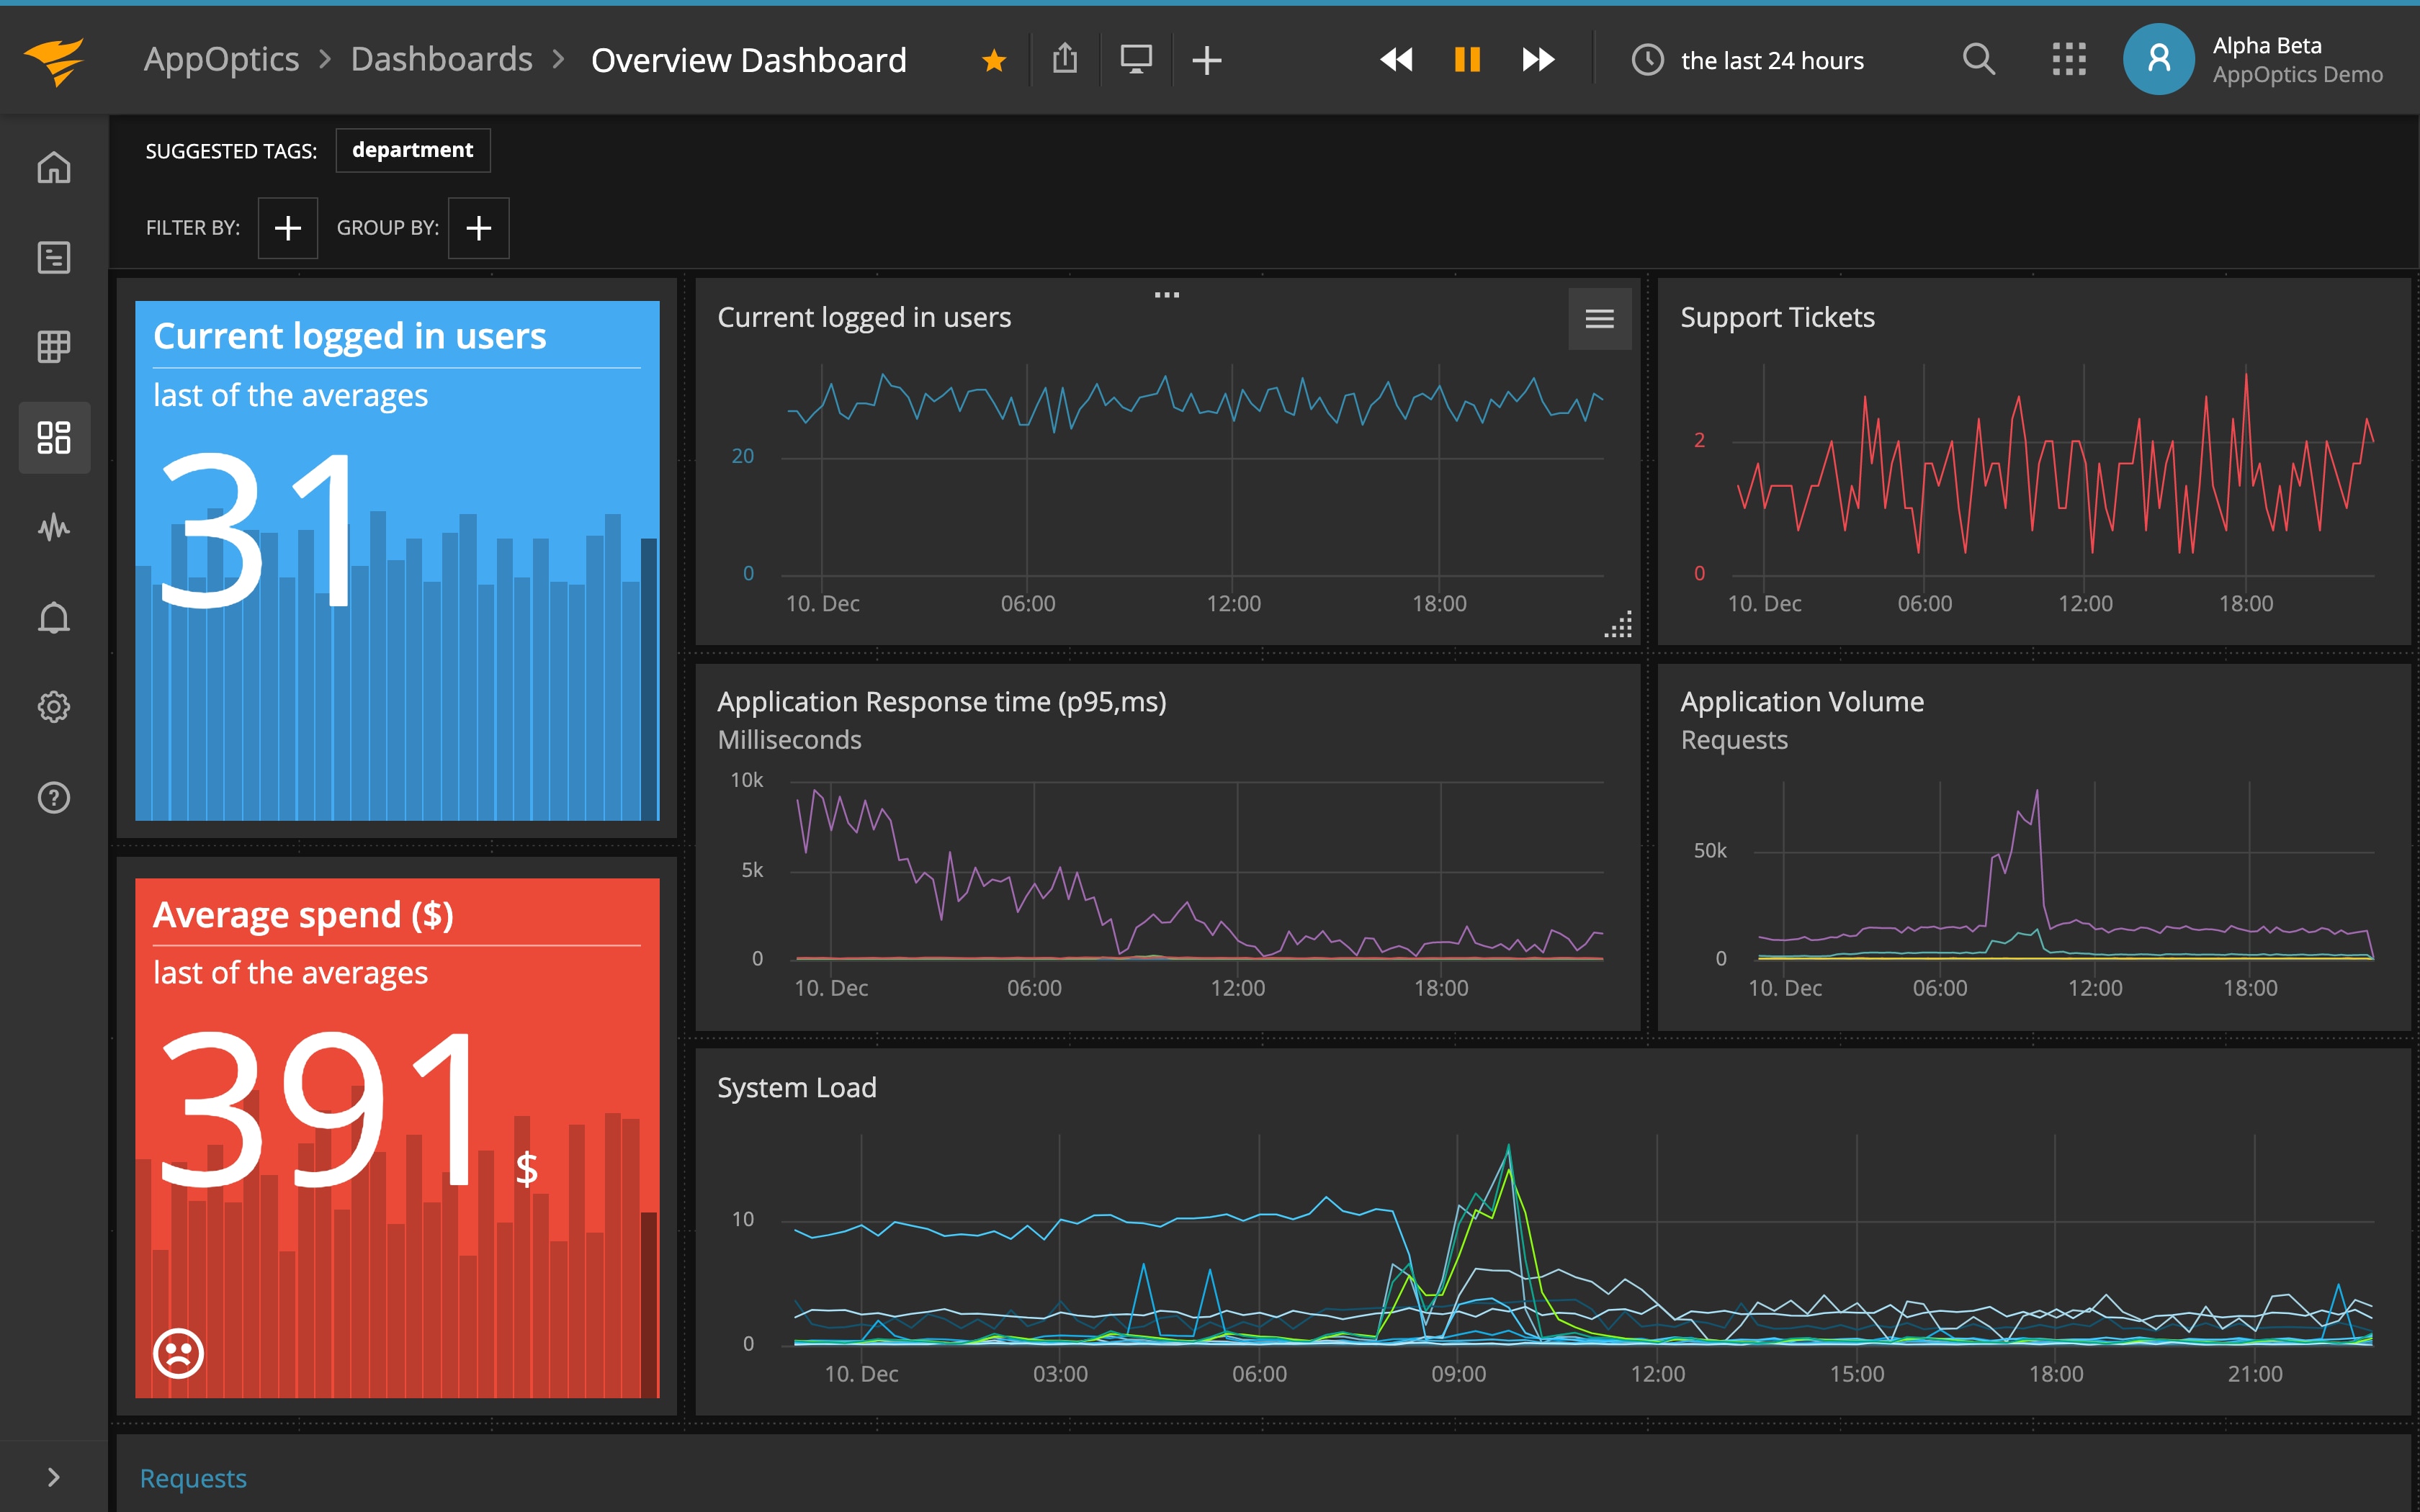
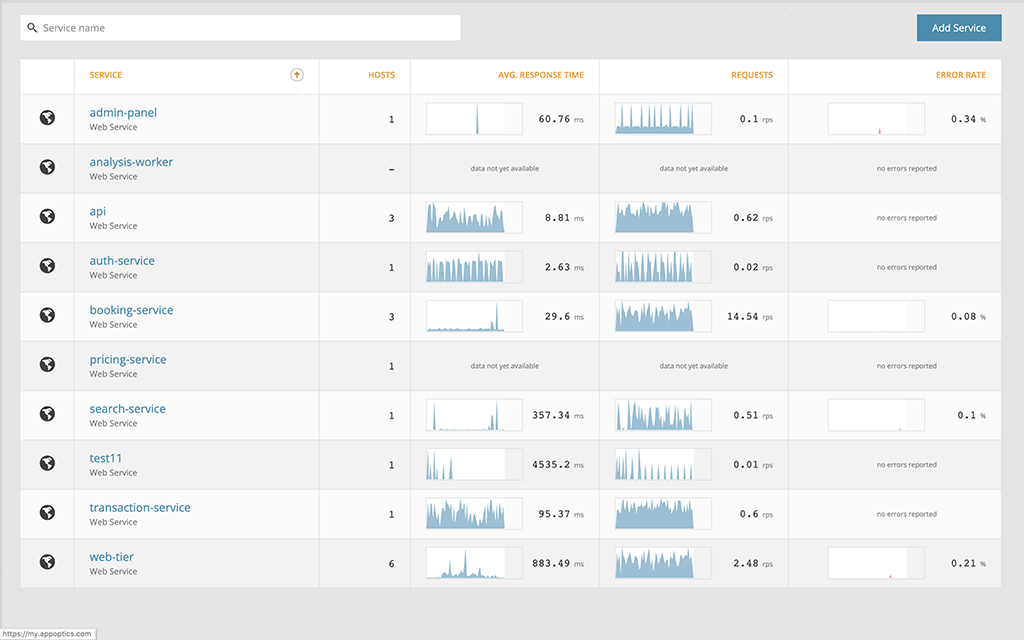
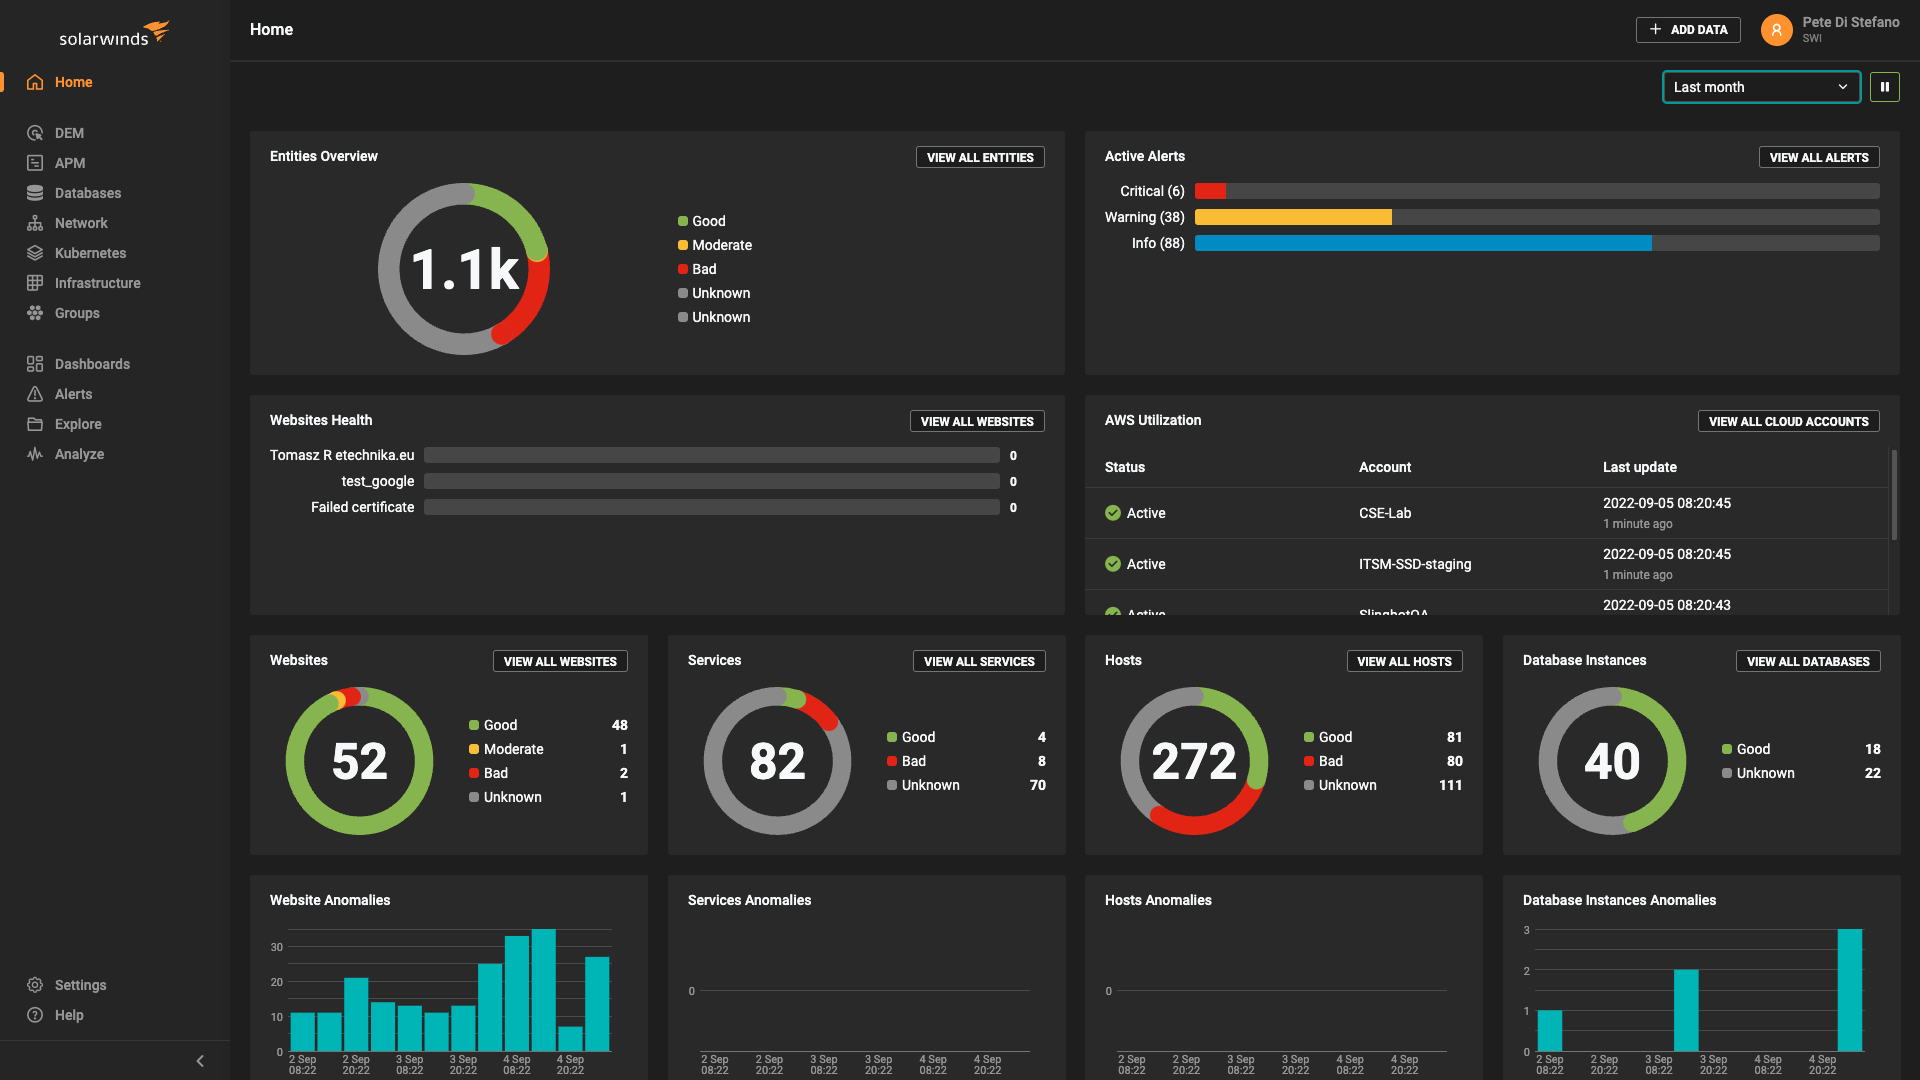
Want to get started with application performance monitoring? Try out SolarWinds® AppOptics™. Through uploading monitoring data, you can view metrics such as CPU usage, ART, and HTTP throughput. Moreover, it allows you to create alerts and detect anomalies, shifting from reactive to proactive monitoring.
Common Problems You Can Solve Through Monitoring
This section lists common problems you can easily detect when you implement monitoring capabilities for your Node.js applications.
High Resource Utilization
As mentioned before, you can measure resource utilization such as memory or CPU usage. High resource usage indicates something is wrong with your code. For example, poorly optimized code can increase resource usage and costs for your organization. Furthermore, monitoring helps you detect performance bottlenecks, improving the overall performance of your application.
Detect API Latency
Next, API latency is detrimental to the user experience. Metrics such as the average response time and peak response time help you detect slow requests. You should check both the internal and external APIs you use. Perhaps you find an external API provides you with slow responses, slowing down the performance of your application as well.
Increased Error Rates
Keeping track of the number of errors and how they’re handled is crucial. An increase in the error rate might indicate something is wrong. Let’s say you’ve released new functionality that contained a bug. Keeping track of the error rate is useful for detecting problems quickly. Monitoring will also give you more insights into why and how the errors are occurring, making it easier to resolve those problems with the enhanced app insights.
How to Implement Alerting for Node.js Apps
Alerting functionality is a must-have for shifting from reactive to proactive monitoring. For example, you can set limits for certain metrics. When your application crosses a metric, you can be sure a problem has occurred or will occur in the future. For example, you can measure the average response time and set an alert for when the ART increases above three seconds.
There are different types of alerts you can create. Here’s a quick overview:
- Heartbeat alerts to detect if your server is down.
- Threshold-based alerts when a certain metric value has been crossed such as the ART example above.
- Anomaly-based alerts to detect patterns in your logs, such as a high number of failed login attempts, which might indicate someone is trying to gain unwanted access. In other words, you want to detect values that deviate from the baseline you’ve set.
Wrapping Up
I hope I’ve shown you how important it is to implement monitoring capabilities. For Node.js specifically, make sure to monitor the Node.js event loop. This metric can quickly show you poorly optimized code, memory leaks, or even performance bottlenecks.
Remember alerting is one of the key aspects of monitoring. You can monitor many metrics; however, you also need to act on them. Alerting can notify you when something is wrong, such as a high average response time for requests.
Lastly, don’t forget monitoring is only possible through logging. Without any logging data, it’s almost impossible to monitor the health of your application. Logs provide valuable insights such as error messages or important application events.
Recommended reading: Learn how to create custom monitoring metrics using SolarWinds AppOptics.
This post was written by Michiel Mulders. Michiel is a passionate blockchain developer who loves writing technical content. Besides that, he loves learning about marketing, UX psychology, and entrepreneurship. When he’s not writing, he’s probably enjoying a Belgian beer!
