A comprehensive set of turnkey infrastructure integrations

Including dozens of AWS and Azure services, web, database, network, containers, orchestrations like Docker and Kubernetes, and more.

START FREE TRIAL

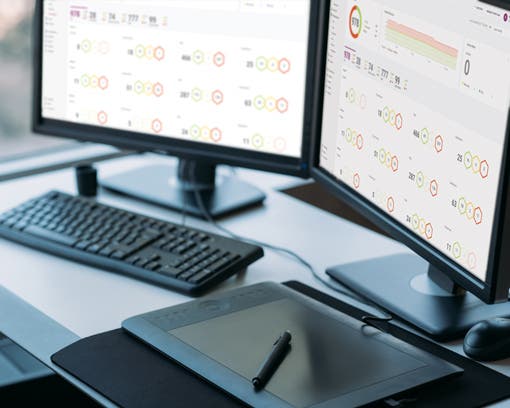
Complete visibility into the health and performance of applications and their underlying infrastructure

Quickly pinpoint the root cause of performance issues across the stack, down to a poor-performing line of code

START FREE TRIAL

Custom metrics and analytics

Analyze custom infrastructure, application, and business metrics

View Custom Metrics Monitoring Info
Powerful API that makes it easy to collect and create any custom metric

Achieve ultimate visibility and enhanced troubleshooting with synthetic and real user monitoring

START FREE TRIAL

Free APM Software

Catch bugs early on, and gain full visibility and insights into the applications you’re developing

View Product Info
Free, full-function APM tool for testing and troubleshooting application performance before moving into production

Dev Edition includes five traces per minute, 100 metrics, three hosts, and six containers

GET FREE TOOL

Log Management and Analytics powered by SolarWinds Loggly

Integrated, cost-effective, hosted, and scalable full-stack, multi-source log management

View Log Management and Analytics Info
Collect, search, and analyze log data in addition to your metrics and traces to quickly pinpoint application performance problems

Reduce mean time to resolution (MTTR) by quickly jumping from a trace or host view into the relevant logs to accelerate troubleshooting

START FRE TRAIL

Digital Experience Monitoring Powered by SolarWinds Pingdom

Make your websites faster and more reliable with easy-to-use web performance and digital experience monitoring

View Digital Experience Monitoring Info
Add client-side web application performance monitoring. Provide maximum observability by adding the user’s perspective.

Achieve ultimate visibility and enhanced troubleshooting with synthetic and real user monitoring

START FREE TRIAL

For an infrastructure to be healthy, there must be good monitoring. The team should have a monitoring infrastructure that speeds up and facilitates the verification of problems, following the line of prevention, maintenance, and correction. AppOptics was created with the purpose of helping monitoring teams control infrastructure, including Linux monitoring.

Monitoring overview

It is critical that a technology team prepare for any situation that occurs in their environment. The purpose of monitoring is to be aware of changes in the environment so that problems can be solved with immediate action. Good monitoring history and proper perception can allow you to suggest environmental improvements according to the charts. If you have a server that displays memory usage for a certain amount of time, you can purchase more memory, or investigate the cause of the abnormal behavior before the environment becomes unavailable.

Monitoring indexes can be used for various purposes, such as application availability for a given number of users, tool deployment tracking, operating system update behavior, purchase requests, and exchanges or hardware upgrades. Each point of use depends on your deployment purpose.

Linux servers historically have operating systems that are difficult to monitor because most of the tools in the market serve other platforms. In addition, a portion of IT professionals cannot make monitoring work properly on these servers, so when a disaster occurs, it is difficult to identify what happened.

Constant monitoring of servers and services used in production is critical for company environments. Server failures in virtualization, backup, firewalls, and proxies can directly affect availability and quality of service.

The Linux operating system offers a basic monitoring system for more experienced administrators, but when it comes to monitoring, real-time reports are needed for immediate action. You cannot count on an experienced system administrator being available to access the servers, or that they can perform all existing monitoring capabilities.

In the current job market, it is important to remember that Linux specialists are rare, and their availability is limited. There are cases where an expert administrator can only act on a server when the problem has been long-standing. Training for teams to become Linux experts can be expensive and time-consuming, with potentially low returns.

Metrics used for monitoring

  1. CPU – It is crucial to monitor CPU, as it can reach a high utilization rate and temperature. It can have multiple cores, but an application can be directed to only one of these cores, pointing to a dangerous hardware behavior.
  2. Load – This specifies whether the CPU is being used, how much is being executed, and how long it has been running.
  3. Disk Capacity and IO – Disk capacity is especially important when it comes to image servers, files, and VMs, as it can directly affect system shutdown, corrupt the operating system, or cause extreme IO slowness. Along with disk monitoring, it’s possible to plan for an eventual change or addition of a disk, and to verify the behavior of a disk that demonstrates signs of hardware failure.
  4. Network – When it comes to DNS, DHCP, firewall, file server, and proxy, it is extremely important to monitor network performance as input and output of data packets. With network performance logs, you can measure the utilization of the card, and create a plan to suit the application according to the use of the network.
  5. Memory – Memory monitoring in other components determines the immediate stop of a system due to memory overflow or misdirection for a single application.
  6. Swap – This is virtual memory created by the system and allocated to disk to be used when necessary. Its high utilization can indicate that the amount of memory for the server is insufficient.

With this information from Linux systems, you can have good monitoring and a team that can act immediately on downtime that can paralyze critical systems.

Monitoring with AppOptics

AppOptics is a real-time web monitoring tool that enables you to set up a real-time monitoring environment, create alerts by e-mail, and focus on threshold and monitoring history. You can also create monitoring levels with profiles of equipment to be monitored, and have simple monitoring viewers that can trigger a specialist or open a call for immediate action when needed.

This tool can also be an ally of an ITIL/COBIT team, which can use the reports to justify scheduled and unscheduled stops, and clarify systems that historically have problems. It can also be used to justify the purchase of new equipment, software upgrades, or the migration of a system that no longer meets the needs of a company.

AppOptics can be installed in major Linux distributions such as Red Hat, CentOS, Ubuntu, Debian, Fedora, and Amazon Linux. Its deployment is easy, fast, and practical.

Installing the AppOptics Agent on the Server

Before you start, you’ll need an account with AppOptics. If you don’t already have one, you can create a demo account which will give you 14 days to try the service, free of charge. Sign up at https://my.appoptics.com/sign_up.

First, to allow AppOptics to aggregate the metrics from the server, you will need to install the agent on all instances. To do this, you’ll need to reference your AppOptics API token when setting up the agent. Log in to your AppOptics account and navigate to the Infrastructure page.

Locate the Add Host button, and click on it. It should look similar to the image below.

Fig. 2. AppOptics Host Agent Installation

You can follow a step-by-step guide on the Integration page, where there are Easy Install and Advanced options for users. I used an Ubuntu image in the AWS Cloud, but this will work on almost any Linux server.

Note: Prior to installation of the agent, the bottom of the dialog below will not contain the success message.

Copy the command from the first box, and then SSH into the server and run the Easy Install script.

Fig. 3. Easy Install Script to Add AppOptics Agent to a Server

When the agent installs successfully, you should be presented with the following message on your terminal. The “Confirm successful installation” box on the AppOptics agent screen should look similar to the above, with a white on blue checkbox. You should also see “Agent connected.”

Fig. 4. Installing the AppOptics Agent on your Linux Instance

After installation, you can start configuring the dashboard for monitoring on the server. Click on the hostname link in the Infrastructure page, or navigate to the Dashboards page directly, and then select the Host Agent link to view the default dashboard provided by AppOptics.

Working With the Host Agent Dashboard

The default Host Agent Dashboard provided by AppOptics offers many of the metrics discussed earlier, related to the performance of the instance itself, and should look similar to the image below.

Fig. 6. Default Host Agent Dashboard

One common pattern is to create dashboards for each location you want to monitor. Let’s use “Datacenter01” for our example. Head to Dashboards and click the Create a New Dashboard button.

You can choose the type of monitoring display (Line, Stacked, and Big Number). Then you can choose what you want to monitor as CPU Percent, Swap, or Load. In addition, within the dashboard, you can select how long you want to monitor a group of equipment or set it to be monitored indefinitely.

Fig. 8. Custom Dashboard to View Linux System Metrics

Metrics – You can select existing metrics to create new composite metrics according to what you want to be monitored in the operating system.

Alerts – Alerts are created for the operating system, including time settings for issuing a new alert and the conditions for issuing alerts.

Integrations – You can add host agent plug-ins for support for application monitoring.

Conclusion

Monitoring your Linux servers is critical as they represent the basis of your infrastructure. You need to know immediately when there is a sudden change in CPU or memory usage that could affect the performance of your applications. AppOptics has a range of ready-made tools, customizable monitoring panels, and reports that are critical for investigating chronic infrastructure problems. Learn more about AppOptics infrastructure monitoring and try it today with a free 14-day trial.

The SolarWinds trademarks, service marks, and logos are the exclusive property of SolarWinds Worldwide, LLC or its affiliates.  All other trademarks are the property of their respective owners.

Related articles

© 2025 SolarWinds Worldwide, LLC. All rights reserved.