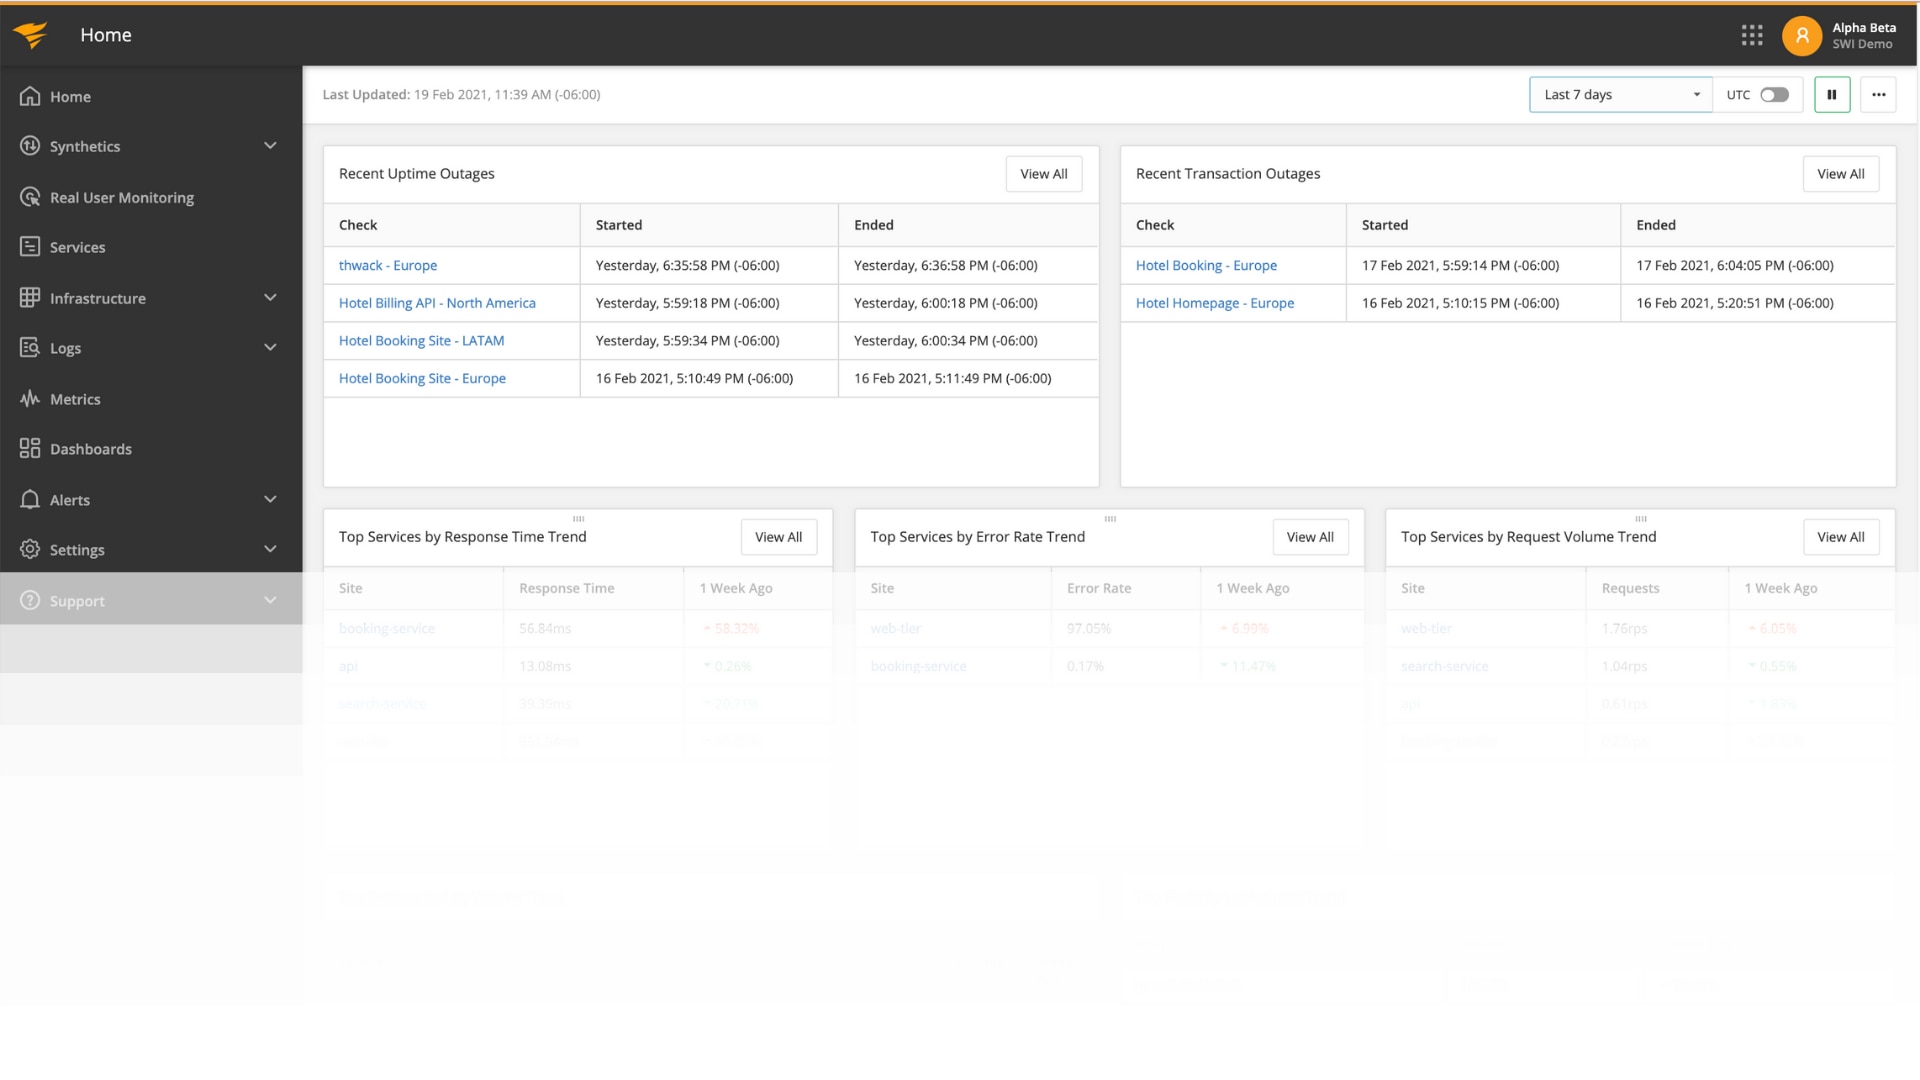
In the first part of this series, we deployed a Django application on a DigitalOcean Droplet and created a simple Django application. To monitor our Django application, we installed the SolarWinds® APM Integrated Experience featuring AppOptics™, Loggly®, and Pingdom®. In the conclusion of this article, we’ll explore the different types of monitoring provided by the APM Integrated Experience. To see the different types of alerts, dashboards and analysis, we’ll create an outage.
Monitoring With the SolarWinds APM Integrated Experience
Using the SolarWinds APM Integrated Experience to monitor our site, we found the site’s overall performance looked good.
AppOptics
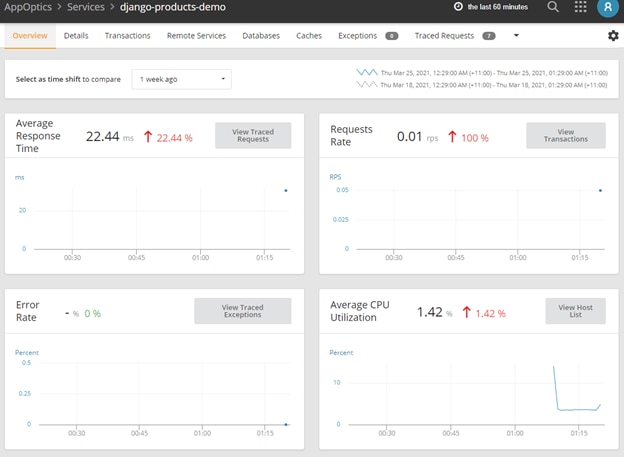
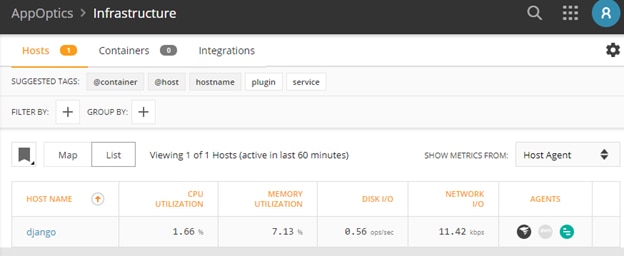
AppOptics showed the service was up and running:

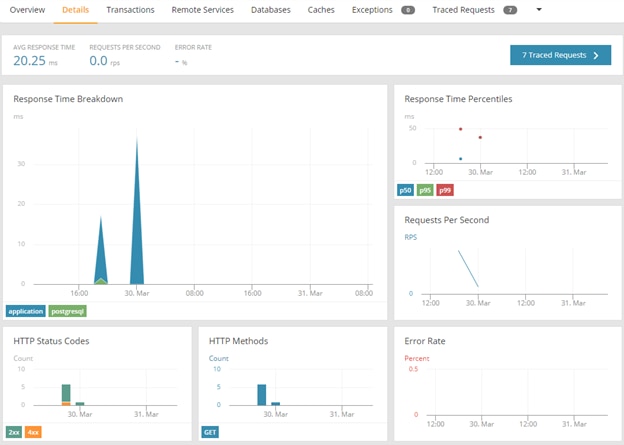
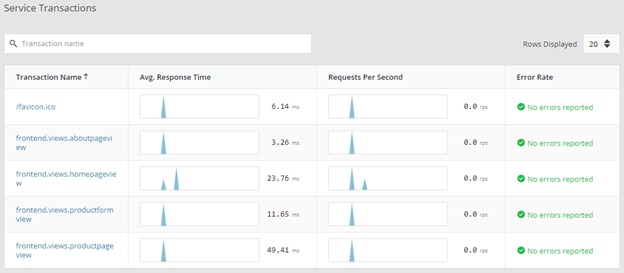
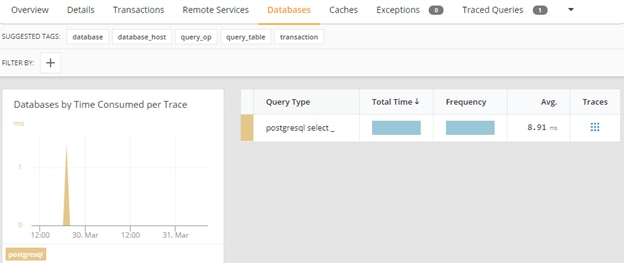
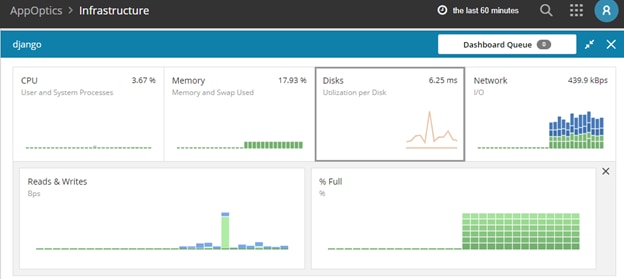
Clicking on the service name allowed us to check detailed information about the service transactions, database, host infrastructure, and so on:
Loggly
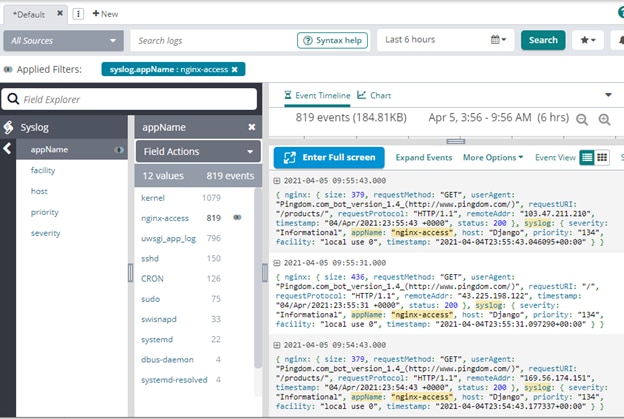
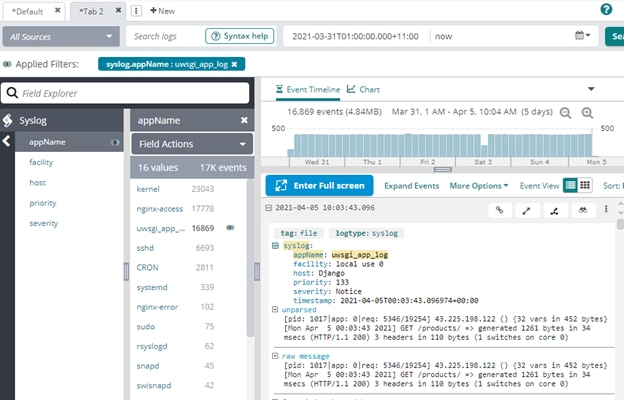
Loggly showed logs from Nginx and uWSGI for our Django site:
Pingdom
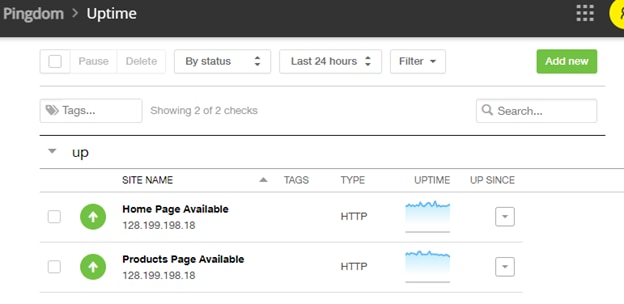
The Pingdom uptime dashboard showed a green status for the two checks we added:

Pingdom
The Pingdom uptime dashboard showed a green status for the two checks we added:

Pingdom
The Pingdom uptime dashboard showed a green status for the two checks we added:
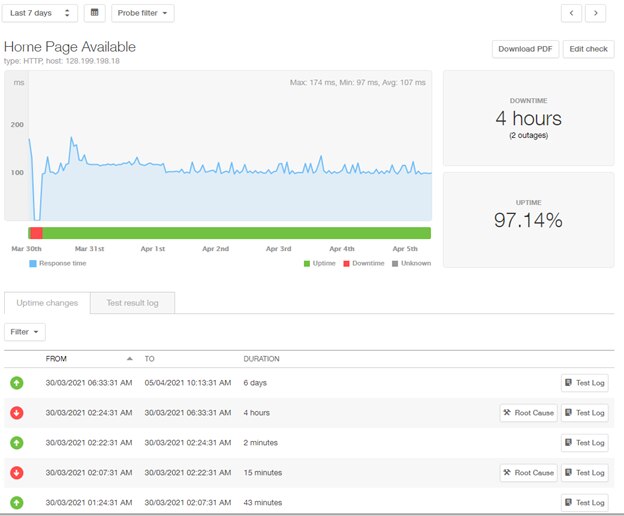
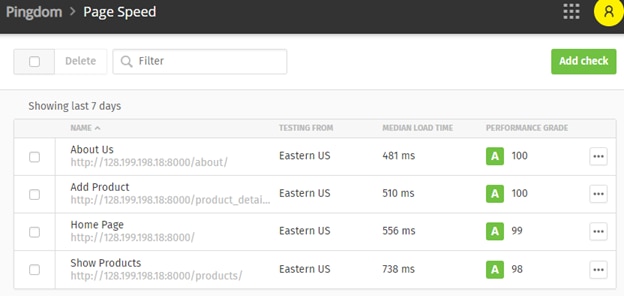
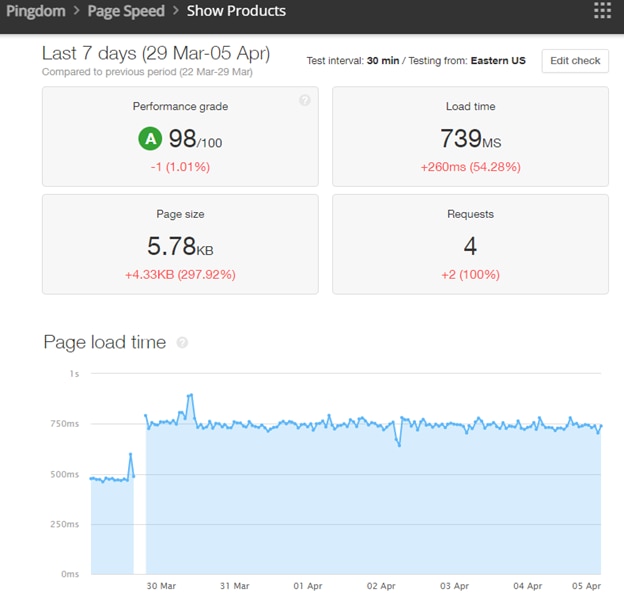
The page speeds were within our expectations:
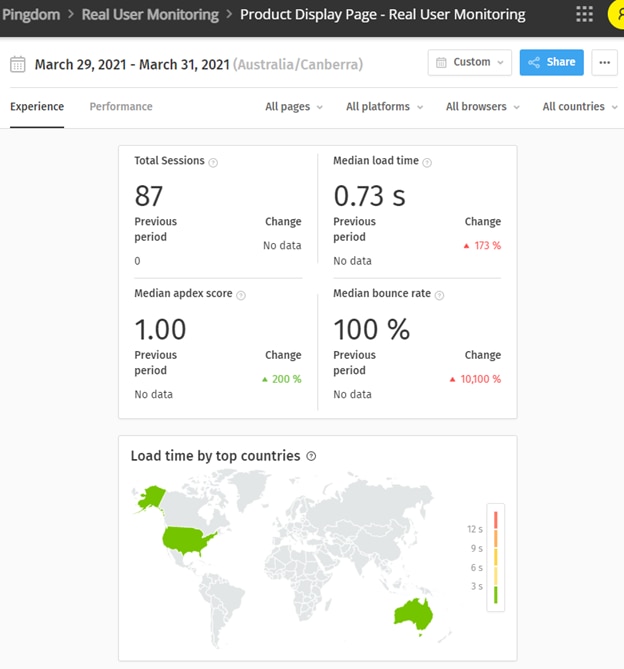
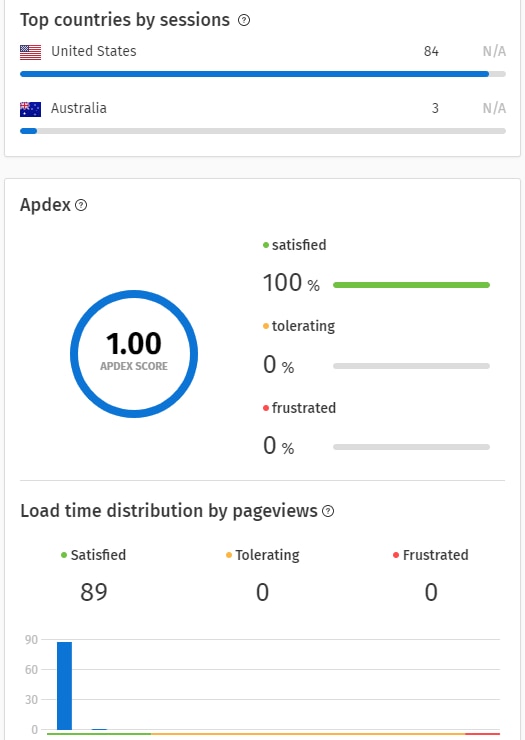
It also reported more detailed information about user sessions:
Creating the Outage
Now, let’s imagine we made some configuration changes to our site as part of a regular application update. Inadvertently, the change caused an outage. How can the operations team identify the root cause from the SolarWinds suite of tools?
To simulate the outage, we stopped the uWSGI service, assuming this was caused by a configuration change in the /etc/uwsgi/apps-available/sampleapp.ini file.
Running the command systemctl stop uwsgi stops the service.
Now, when we browsed to our site, we saw a 502 Bad Gateway message:

A 502 Bad Gateway means there’s something wrong with the site’s back-end server. It’s tempting to think Nginx is at fault. In reality, Nginx is showing the message, which means it’s running, and it can be anything powering the site’s back end.
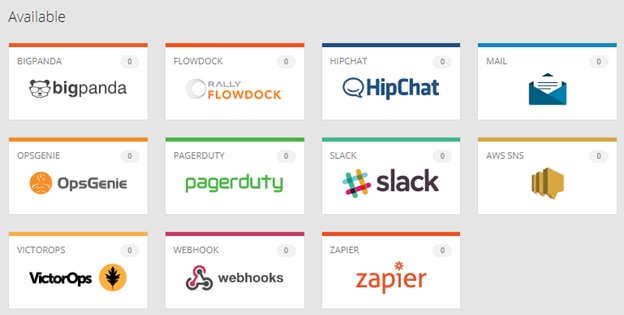
Even before your users see this error, you could be automatically notified from AppOptics through any of these channels:
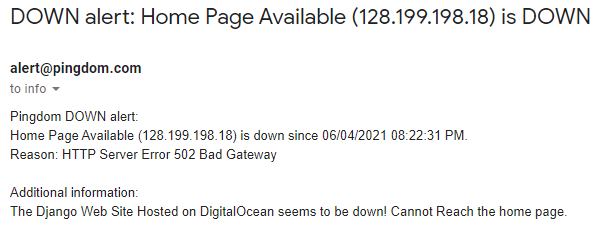
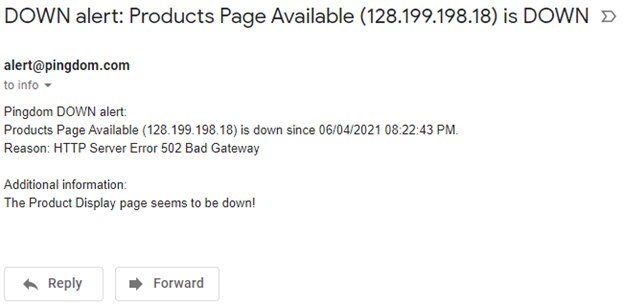
Also, we received email notifications from Pingdom as the site availability checks failed:
How SolarWinds Monitoring Identifies Root Cause
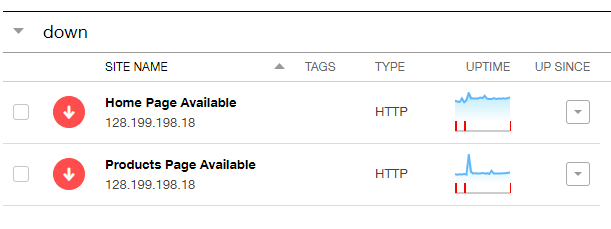
From the Pingdom site availability dashboard, we could see both the checks were red:
Such an outage would be visible from the AppOptics interface as well for the service.
Usually the first port of call during an outage are the logs. In this case, the 502 Bad Gateway message was shown by Nginx, so it made sense to check the Nginx logs first, particularly the error log. We decided to check this log from the search screen in Loggly:
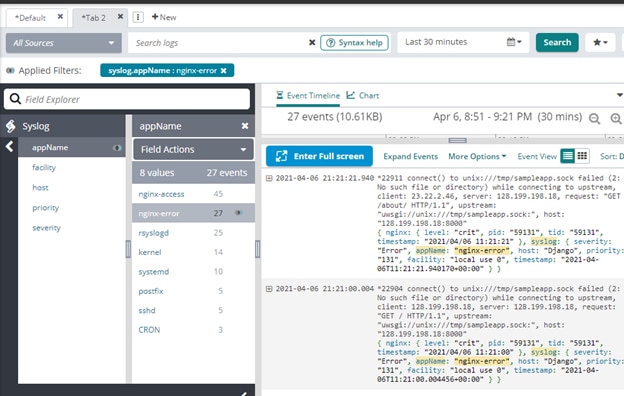
Expanding the messages showed a common trait:
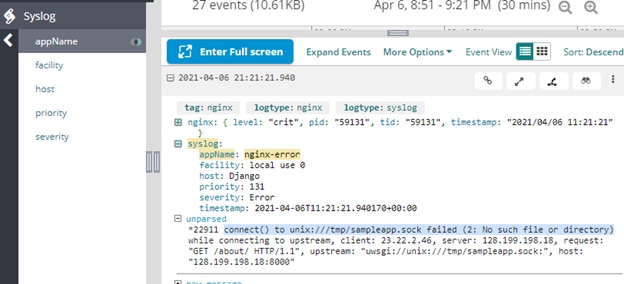
Nginx couldn’t find the sample.sock file—the file uWSGI and Nginx used to talk to each other. Checking the existence of the file from the operating system prompt returned no results:

Next, we checked the Nginx sites-enabled directory and read the contents of the sampleapp configuration file:
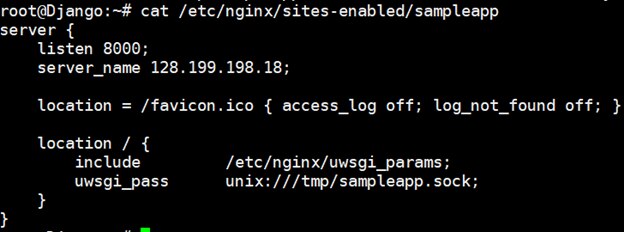
Obviously, Nginx was having trouble finding this file, which meant uWSGI service was probably not running, so the file wasn’t there either.
Checking the uWSGI service status showed us it was indeed stopped:
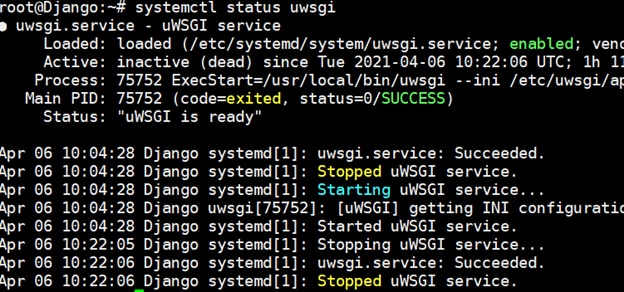
The next step for us was to “correct” or “rollback” our change in the uWSGI service configuration file and restart the service.
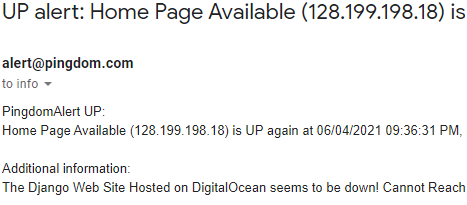
This resolved the issue and the site was back up. The email message confirmed this:
Conclusion
As you saw in this article, we implemented SolarWinds monitoring for a Django application running on a DigitalOcean cloud server. The application had a few components in the stack, and SolarWinds was used to capture the health of each layer. We also received proactive alerts and used the captured logs to troubleshoot an outage.
Does this mean you should monitor everything in each layer of your application? Not necessarily. Proactive monitoring isn’t about monitoring every moving part of your application; it’s more about monitoring intelligently, so you’re ahead of the game. It also depends on the application architecture.
For example, you may find it necessary to capture only a few key metrics from your database but not its logs. On the other hand, you may want to trace each call made between the microservices to pinpoint any broken links. In our example, we didn’t use any front-end frameworks like Angular, React, or Vue. If we did, those could be monitored as well.
For holistic monitoring of your Django application, look at the SolarWinds APM Integrated Experience. It offers a single pane of glass to help you get the complete view of a modern, multi-layered application. This solution integrates user, metric, trace, and log data into a single UI, providing complete observability. The APM Integrated Experience integrations, built-in metrics, dashboards, and advanced visualization capabilities. To learn more and start a free trial visit the site.


