Apache Cassandra is an open-source, distributed database management system specifically built for organizations needing to handle large volumes of data, including when said data is spread across many commodity servers. Cassandra development began at Facebook but later became an open-source Apache project. Now, it’s widely used by some of the biggest enterprises, like Uber, Spotify, eBay, and smaller developer teams.
Apache Cassandra Basics
Cassandra is a NoSQL database. Unlike table-based relational databases, NoSQL or non-relational databases typically store data in the JSON format, with attributes stored within separate documents. NoSQL databases are designed to handle unstructured data and can manage large amounts of information through horizontal scalability. The Cassandra database is built to offer high availability over a global distribution, and they enable applications to write data to any node in a cluster. For this reason, it’s common to see Cassandra used in high-traffic cloud applications.
In terms of architecture, Cassandra servers are arranged in a ring topology, which means no server in the cluster is a “master” or “slave”—they all have equal responsibility. And since every server hosts replicas of an application’s data, if one server goes down, another server can take over. This means there’s no failover in the Cassandra cluster since it’s an evenly distributed system.
Cassandra is a Java application which means it runs in a Java Virtual Machine (JVM). As a result, its metrics can be collected by using Java Management Extensions (JMX). Java performance tuning is part of Cassandra monitoring, and database administrators (DBAs) need a tool to trap JMX counters and events if they want to fully monitor their Cassandra databases.
How to Get Started With Monitoring Cassandra
Databases must be high performing and reliable to serve applications. If your database has low-performing throughput and is unable to send and receive requests efficiently, you’re more likely to experience bottlenecks in your critical applications. At the end of the day, no amount of coding can keep an application running smoothly if the database itself is subpar.
This is why it’s important to monitor the following Cassandra database performance metrics. These six categories help reveal the database’s throughput performance and allow you to pinpoint the source of the problem.
1. Make sure you have sufficient physical resources
Although monitoring your network’s physical resources might not seem to be specific to Cassandra monitoring, in fact, these metrics are critical for ensuring your database operates correctly. Start with CPU utilization metrics, especially CPU percentage, gathered from the node’s or server’s operating system. If there aren’t enough compute resources being sent into the cluster, you’re bound to encounter bottlenecks in your database.
You should also monitor heap memory usage, which shows the relationship between Java heap memory dedicated to the JVM and the max memory it can be assigned to it. If the ratio is high, it can indicate the JVM is nearing maximum memory capacity.
It’s also prudent to monitor disk load, which is the amount of data in the node’s disk Cassandra is managing. If there’s a big difference in the numbers across the nodes in your cluster, take it as a sign your data isn’t evenly distributed and adjust accordingly.
2. Always check the speed and number of client requests
In addition to monitoring physical network resources, it’s important to note how quickly client requests are being sent, received, and fulfilled. One of the most important metrics to track in this space is the number of connected native clients. This metric will offer insights into the volume of client connections attached to each node. If there are prolonged or sudden spikes in traffic, this might be a sign something is wrong in your database.
3. Measure throughput to see how the system handles the workload
In addition to tracking client requests, it’s wise for DBAs to keep tabs on throughput metrics. To accomplish this, you should monitor read and write request rates, which will tell you how many reading and writing requests your nodes are coordinating each second.
To understand throughput, it’s also helpful to monitor cache hit rate values. These attributes indicate the number of times per minute a read request locates a key in the memory cache. The higher the number, the better.
4. Track latency to ensure request times are low and stable
Latency is one of the most important metrics to monitor when it comes to Cassandra databases. Monitoring latency can offer DBAs a more holistic view of their overarching Cassandra performance and help them identify problems potentially developing in a cluster.
One of the most important facets of latency monitoring is tracking the speed at which read and write requests are fulfilled. Often measured in microseconds, these metrics represent the amount of time it takes for a client’s read or write request to be completed. Read and write latency can also be represented in percentiles if you want to compare nodes or implementations.
In general, you want to be sure the values are small and as steady as possible. If your latency numbers begin to rise, it might be an indicator there’s not enough capacity to fulfill client requests or the task queue is growing too large. You should then make adjustments to avoid experiencing a bottleneck elsewhere in your database.
5. Keep tasks moving through your Cassandra queue
Thread pool metrics are helpful because they show the amount of pending or blocked tasks on the node. Typically, these metrics should always be at zero or close to it.
In order to keep your Cassandra queue moving, it’s important to track the total number of tasks within the queue, and those waiting for processing threads. It’s also a good idea to track any blocked tasks since they could indicate a full task queue.
Compaction metrics can be an indicator of issues related to your Cassandra queue. One of the best indicators of compaction performance is the volume of pending tasks in the queue, which also helps you understand if the disk space is under pressure.
6. Ensure Java garbage collection is at a manageable level
Java performance tuning is another critical aspect of Cassandra, especially as it relates to garbage collection. An increase in the Java garbage collection means the Java heap memory needs to be resized to fit the needs of the database. It’s important to monitor the following metrics within your JVM environment:
• ParNew Collection Count
• ParNew Collection Time
• CMS Collection Time
• CMS Collection Count
Finding a Cassandra Monitoring Solution
In order to automatically keep track of all these metrics, you should invest in a database monitoring tool capable of tracking key attributes from Cassandra databases and related systems. SolarWinds® AppOptics™ offers this capability.
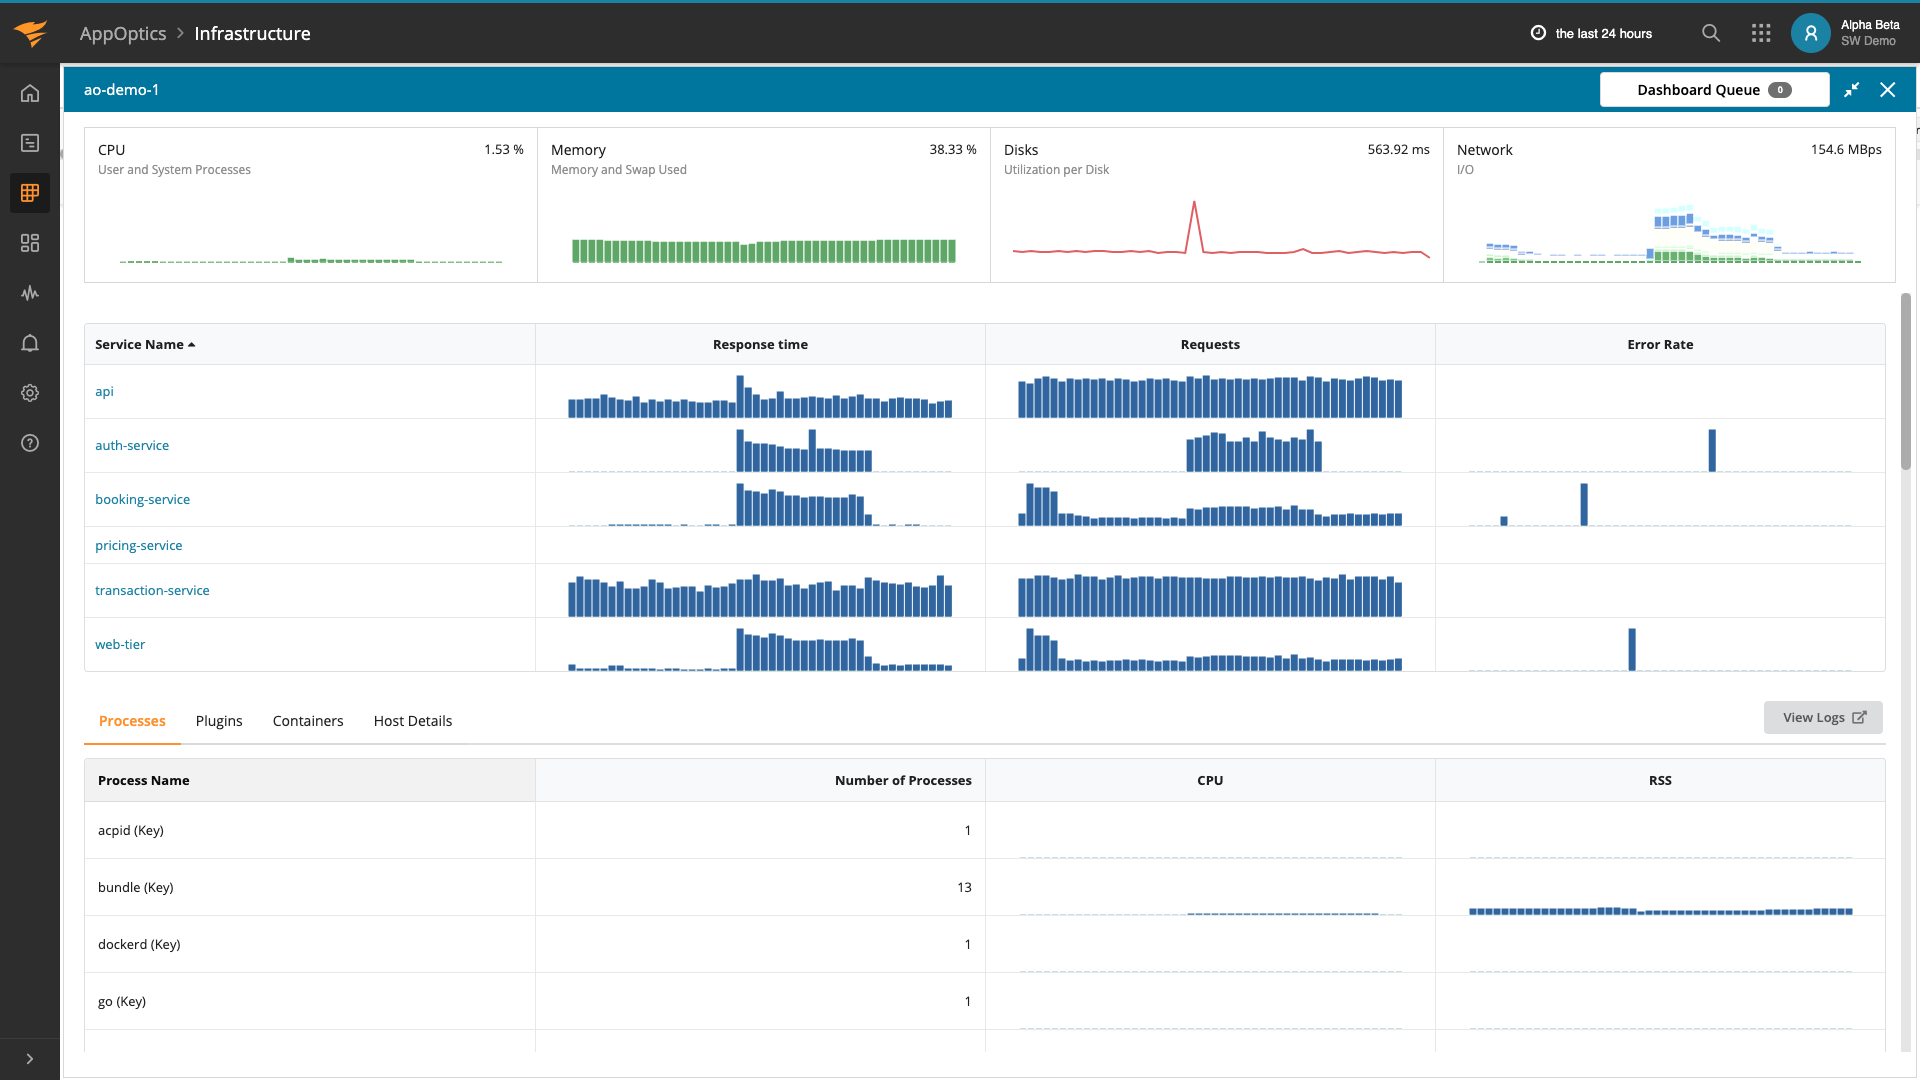
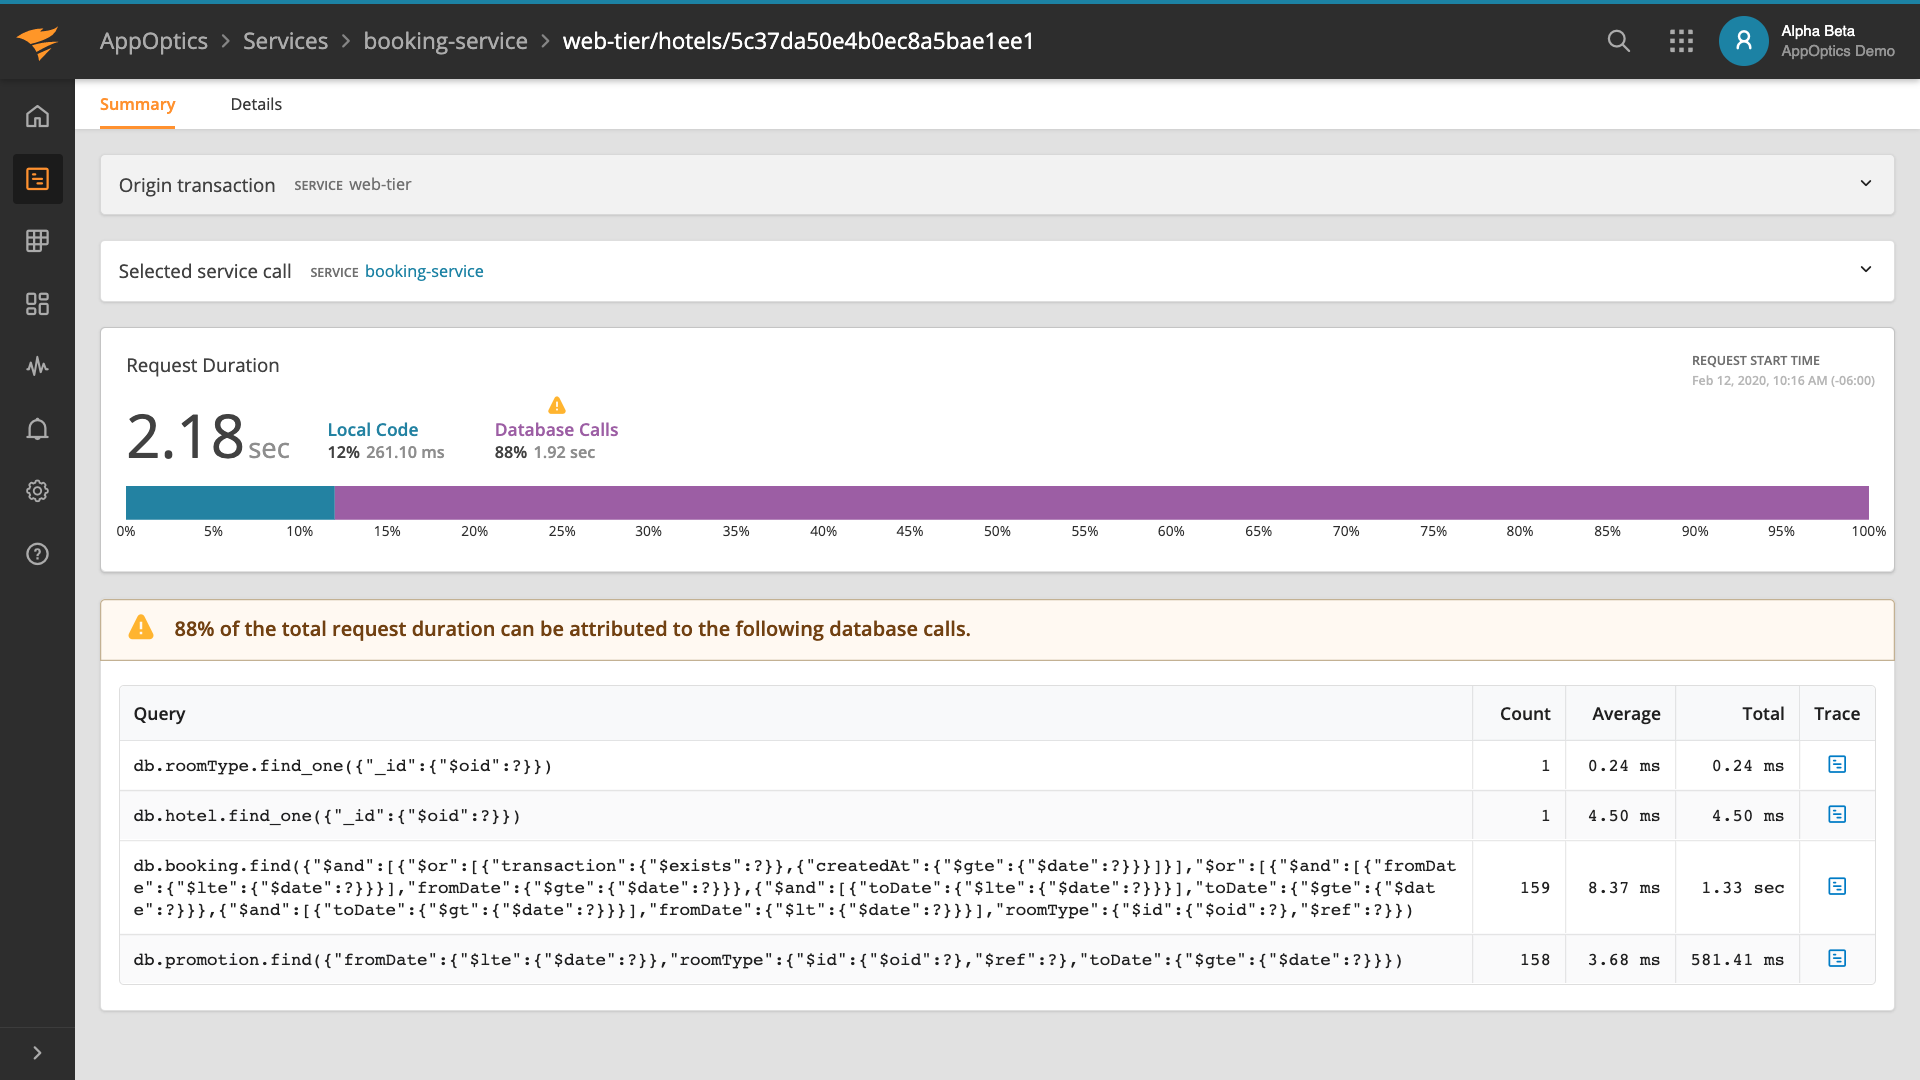
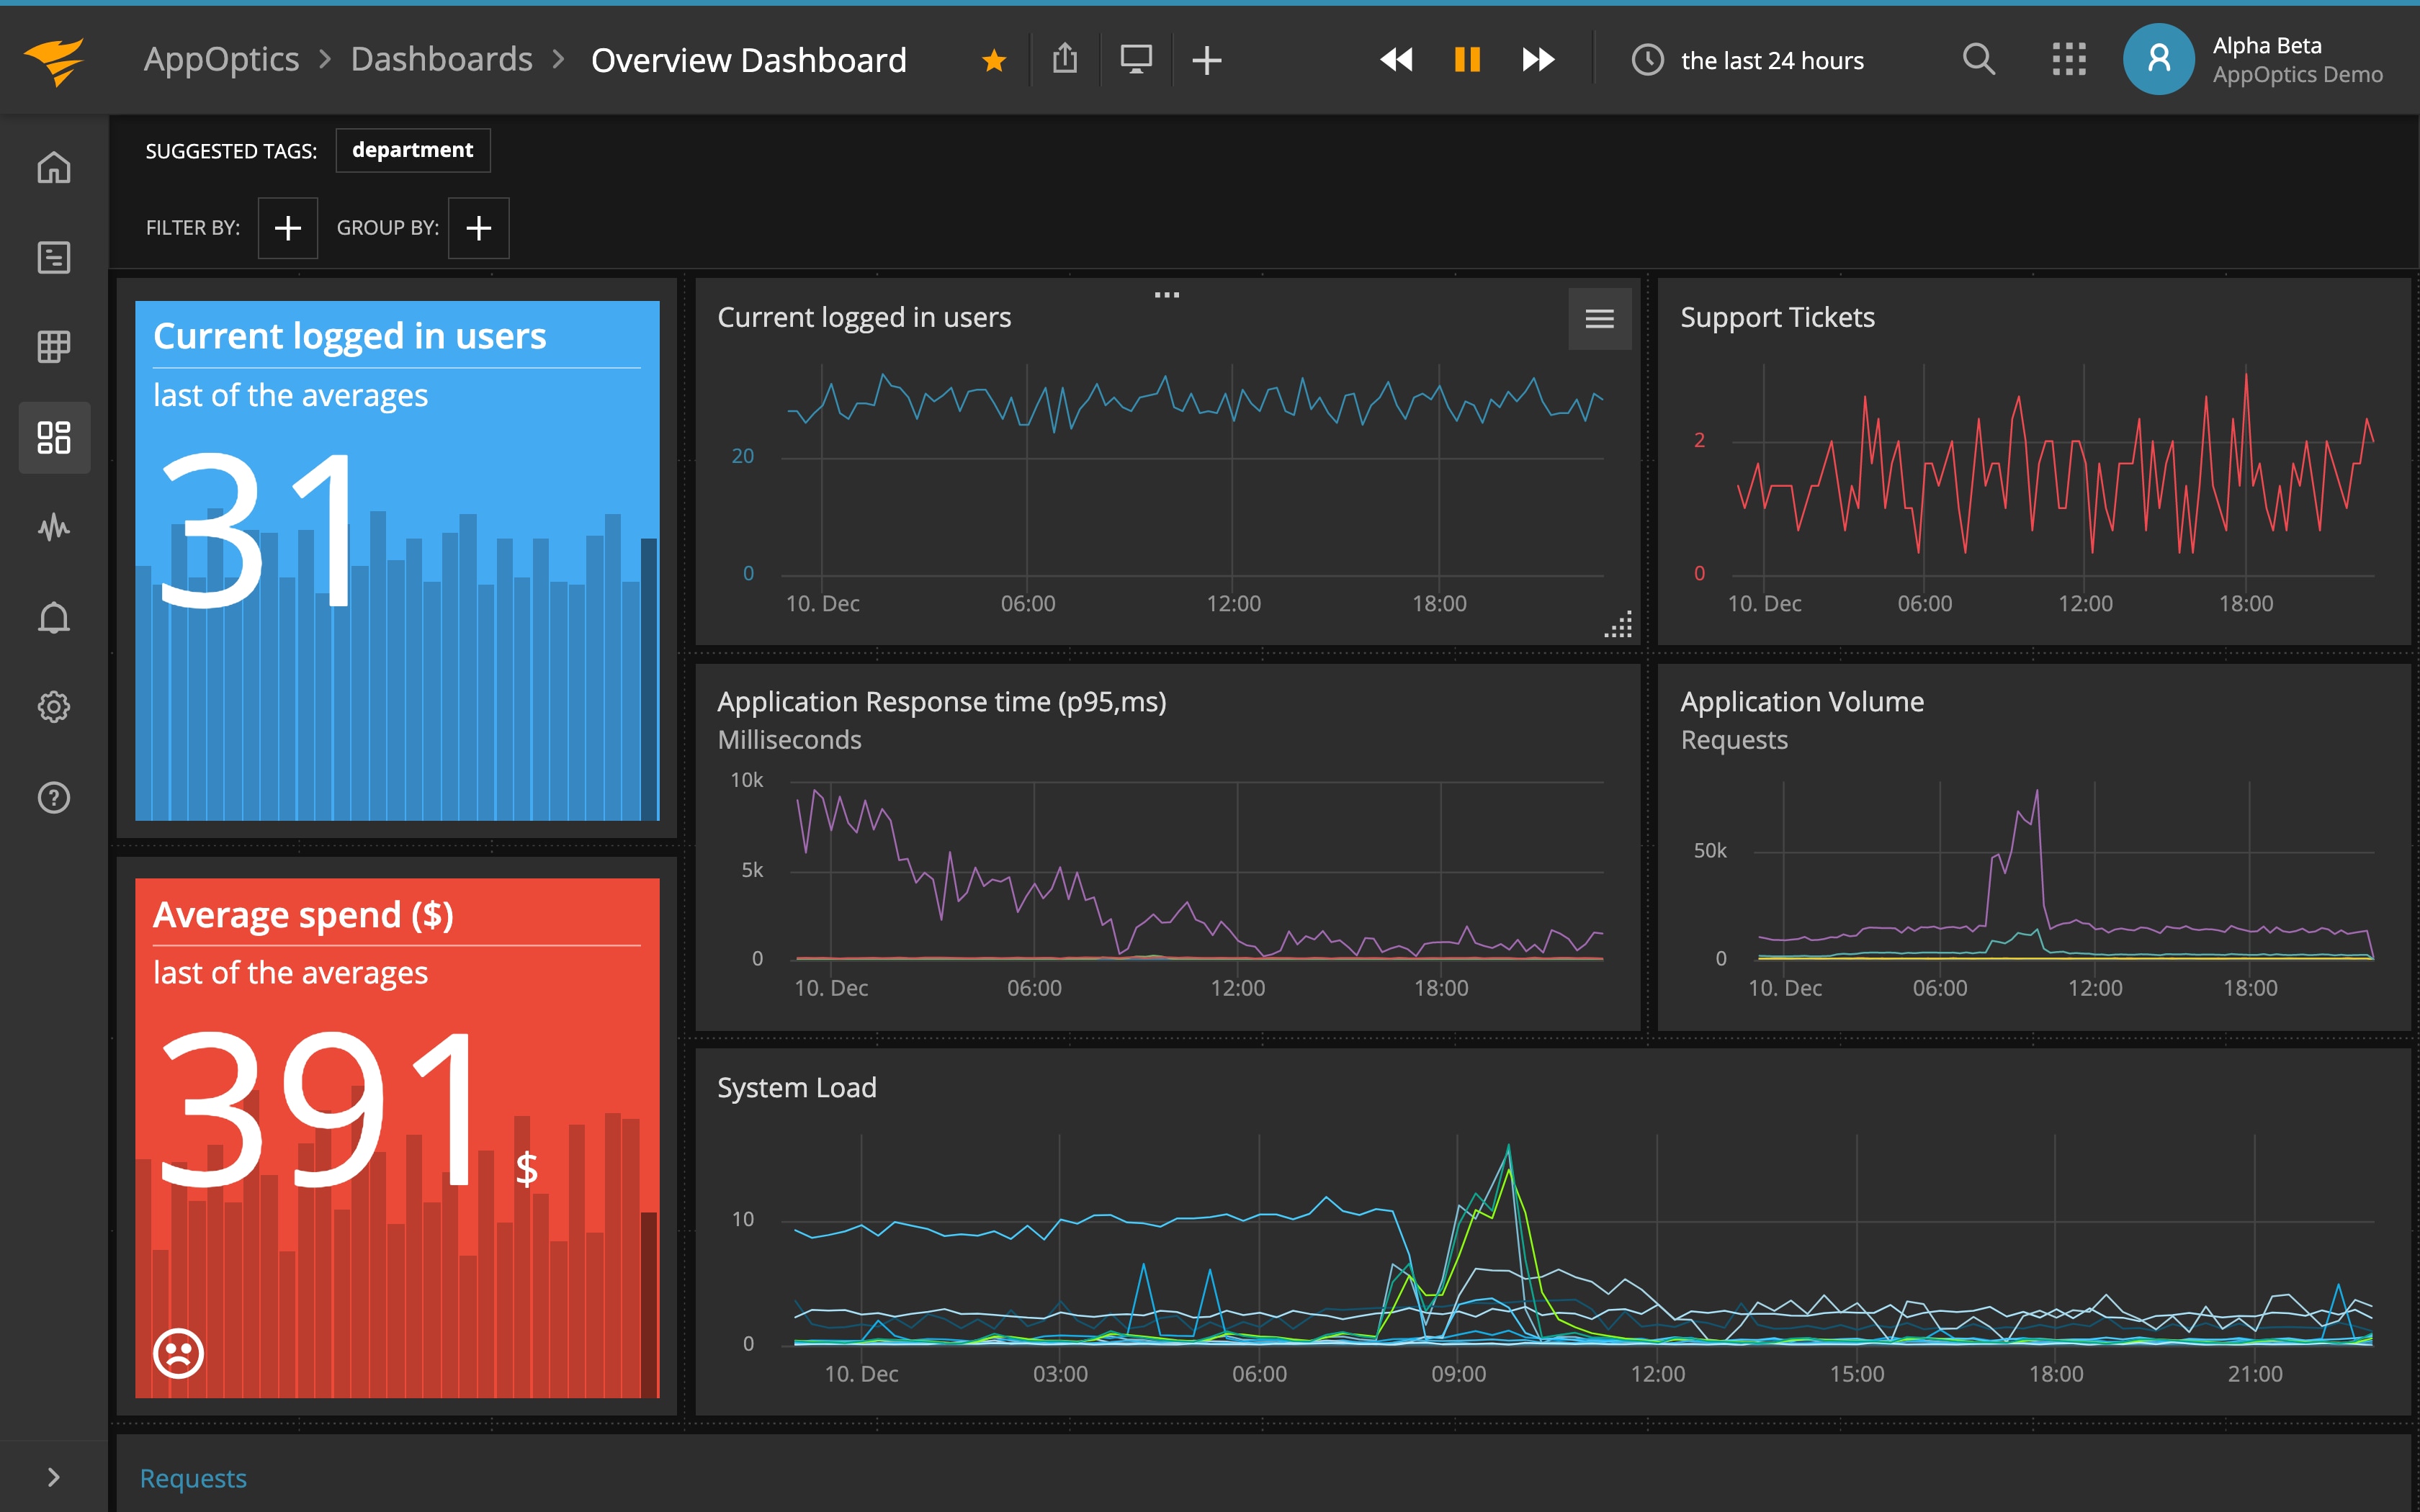
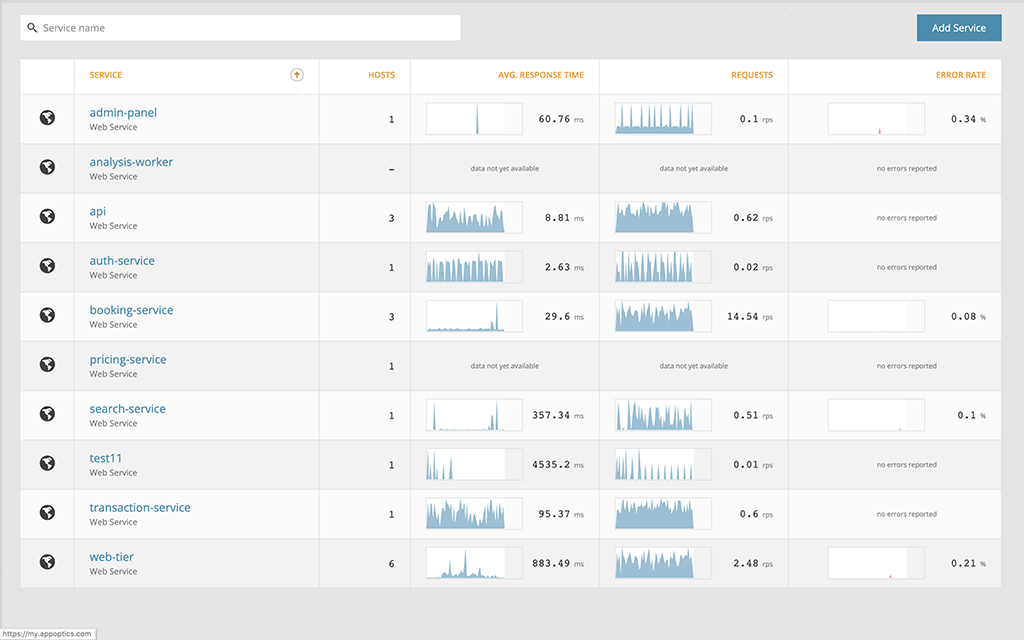
AppOptics is an application performance monitoring (APM) solution with a wide range of helpful tools and features. AppOptics dashboards and alerts give you the visibility you need to proactively respond to problems potentially impacting performance or availability. AppOptics can help DBAs trace distributed queries in a Cassandra environment, monitor network resource use, measure database throughputs, and connect relevant queries to any infrastructure bottlenecks.
If you have applications running on Cassandra, AppOptics will help you measure the performance of the entire stack, from API functionality all the way to an application’s granular lines of code. To start monitoring your Cassandra database within minutes, sign up for a free trial of AppOptics today.
