
Introduction
Since its introduction in 2014, Kubernetes has become the de-facto standard for deploying and scaling containers for cloud deployments and on-premises environments. Initially, it required a DevOps/SRE team to build, deploy, and maintain the Kubernetes deployment in the cloud. Now, all major cloud vendors provide a managed Kubernetes offering, freeing up teams to focus on managing and scaling the application instead of the infrastructure. In fact, according to a Cloud Native Computing Foundation (CNCF) survey, 78% of respondents in late 2019 were using Kubernetes in production.
One of the most important reasons for this explosive growth and success is directly related to how Kubernetes enables scaling in three key ways: vertically by creating containers with higher resource limits, horizontally by creating multiple containers, and across Kubernetes clusters via federation.
This article will demonstrate just how easy it is to deploy, monitor, and scale an Apache web server deployed on Kubernetes—a significantly easier task when compared to scaling manually via virtualization or multiple daemon instances. We’ll use SolarWinds® AppOptics™ and SolarWinds Loggly® to keep track of what takes place within our containers and Kubernetes itself.
Deep Dive
Before we deploy our Apache web server, we need to get our AppOptics and Loggly integrations set up. These are important for a few different reasons:
- AppOptics allows us to collect metrics across the Kubernetes nodes, from Kubernetes itself, and the containers. This allows for correlation that cannot otherwise be generated from the built-in metrics server.
- Loggly has similar integrations across the different layers within Kubernetes—the nodes running Kubernetes, the Kubernetes control plane, and from within running containers.
When you combine the metrics and logging across the application stack, it’s possible to have a more holistic view of performance and a more precise way of troubleshooting issues. We can build alerts to be triggered when containers use too many resources when they fail, and then use AppOptics and Loggly to understand what leads to those issues. Adding visibility and understanding helps to ensure team members can support their application better, fix problems faster, and give greater context to SRE team members in supporting the engineering organization.
Let’s deploy AppOptics and Loggly, so we can start collecting information across the platform. The first step is to create secrets with the tokens we use to communicate with SolarWinds:
kubectl create secret generic solarwinds-token -n kube-system --from-literal=SOLARWINDS_TOKEN=<YOUR_TOKEN_HERE>

kubectl create secret generic loggly-token -n kube-system --from-literal=LOGGLY_TOKEN=<YOUR_TOKEN_HERE>
In this case, we have a separate token for Loggly; in most cases, the SolarWinds token will be shared across all platforms. With the tokens created, we need to deploy the SolarWinds Snap Agent to Kubernetes by first cloning the repository:
git clone git@github.com:solarwinds/solarwinds-snap-agent-docker.gitOnce the repository is cloned, we need to edit deploy/overlays/stable/deployment/kustomization.yaml and change:
- SWISNAP_ENABLE_KUBERNETES=falseto
- SWISNAP_ENABLE_KUBERNETES=true
- SWISNAP_ENABLE_KUBERNETES_LOGS=true
We can then deploy the agent:
kubectl apply -k ./deploy/overlays/stable/deploymentOnce deployed, the agent will spawn a single pod that integrates with the Kubernetes API and send Kubernetes-specific metrics to AppOptics. The next step is to deploy the daemon set—this will run a pod on each node in your cluster and publish host and Docker metrics to AppOptics. While customizations are possible (see the configuration documentation here), we can deploy the daemon set as is:kubectl apply -k ./deploy/overlays/stable/daemonsetWe also want to collect Kubernetes cluster events and send them to Loggly/Papertrail™—the git repository includes a sample configuration that sends Normal (i.e. information-level) events collected in the default namespace. Create a config map named task-autoload from the file:
kubectl create configmap task-autoload --from-file=./examples/event-collector-configs/task-logs-k8s-events.yaml --namespace=kube-systemWe can then deploy the event collector:
kubectl apply -k ./deploy/overlays/stable/events-collector/If we fire up AppOptics and go to the Infrastructure -> Integrations page, we can enable the Kubernetes plugin:
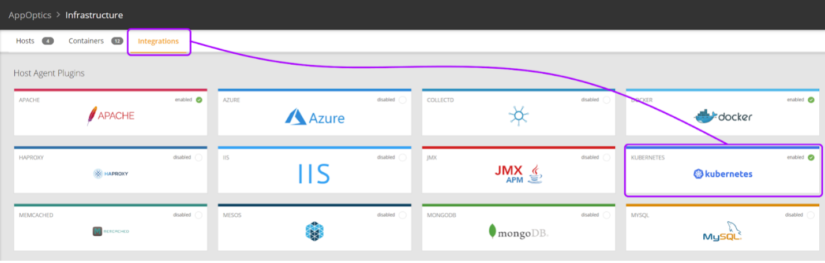
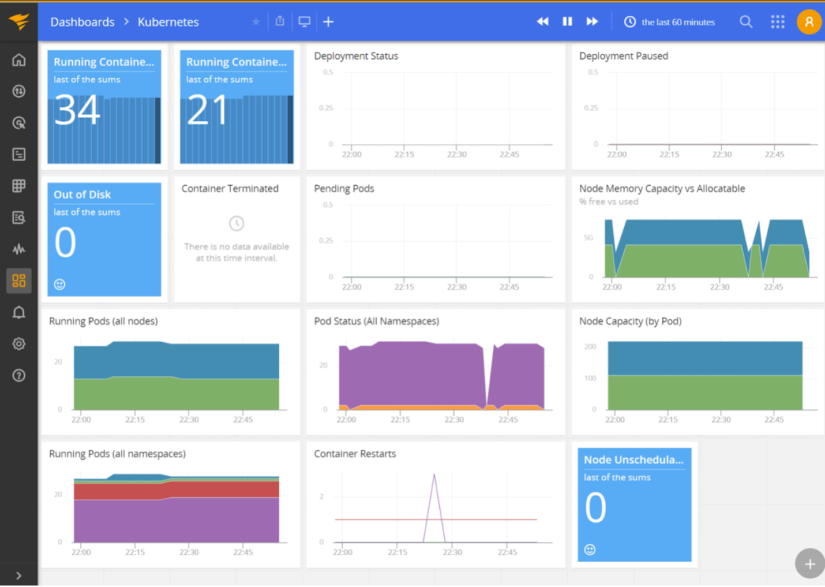
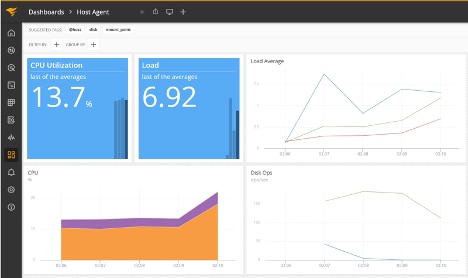
With this enabled, we now gain access to the Kubernetes dashboard, which should start populating with information collected from the agent:
The next step is to integrate Loggly, which will collect logs from the containers themselves. Download the most recent rkubelog release from the SolarWinds GitHub repository—we used r17 for this article. Modify the kustomization.yaml file to include the Papertrail or Loggly config. While rkubelog can send to both, you’ll most likely use one. Once configured, you can deploy to Kubernetes:
kubectl apply -k .After we deploy our Apache web server, we’ll return to Loggly to see what logs rkubelog has collected for us. To deploy Apache, we’ll use Helm to deploy a chart. First, add the Bitname Helm repository:
helm repo add bitnami https://charts.bitnami.com/bitnami
helm repo update
We’ll create a customized deployment descriptor for the Apache + PHP deployment. This is because we want to create a limited deployment with only one instance with restricted resources, ensure a Kubernetes service is created, export metrics, and map an ingress to the service for external validation. We also want to use a PHP script that generates CPU load to ensure our usage increases. Here are the customized values.yaml for the Bitnami Apache helm chart:
image:
  registry: docker.io
  repository: mlaccetti/apache-php
  tag: 8.0.3

ingress:
  enabled: true
  hostname: solarwinds-apache.local
metrics:
  enabled: false

service:
  type: ClusterIP

replicaCount: 1

resources:
  limits:
    cpu: 100m
    memory: 128Mi
  requests:
    cpu: 100m
    memory: 128Mi
We can then run the helm command-line tool to deploy the complete stack:
helm install -f values.yaml apache bitnami/apache --version 8.5.1 --create-namespace --namespace defaultTo validate the deployment is working, check via kubectl:
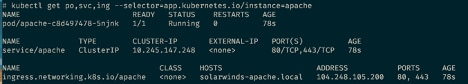
We can see the pod is running (it shows 1/1 since there’s only one container as part of the pod). The check also shows our service has been provisioned, and the ingress is configured. To test the ingress, simply add solarwinds-apache.local to your hosts file (/etc/hosts for macOS and Linux, C:\Windows\System32\drivers\etc\hosts on Windows) and visit it in your browser. If you get an “It works!” message, everything’s working correctly.
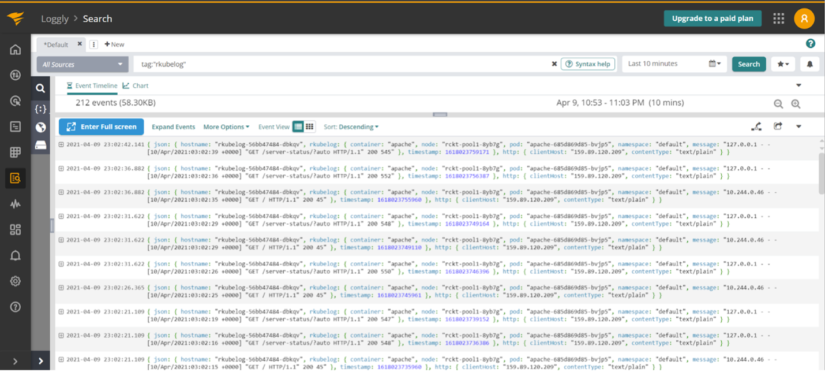
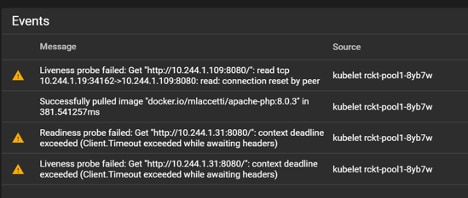
We can also check in Loggly—we should see some of the Kubernetes liveness probes showing up in the logs:
At this point, we have validated that our integration with AppOptics and Loggly works, and our Apache web server is deployed and now accepts traffic. Let’s install k6 to do some load generation, so we can monitor how Apache resource consumption changes. We created a simple load test script called load.js:
import http from 'k6/http';
import { sleep } from 'k6';

export let options = {
  insecureSkipTLSVerify: true,
};

export default function () {
  http.get('https://solarwinds-apache.local/hurt.php');
  sleep(1);
}
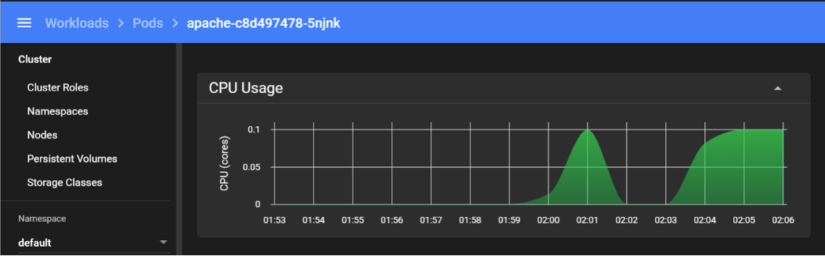
We then use k6 (k6 run --vus 5 --duration 60s load.js) to run a load of five virtual users against our Apache web server and monitor performance in AppOptics:
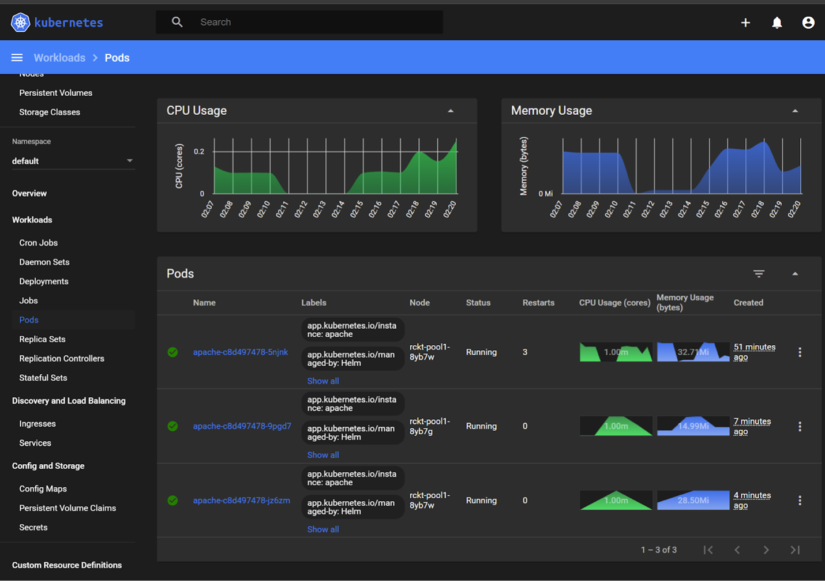
We can also look at the Kubernetes dashboard itself and see our pod is hitting our CPU usage limit, getting throttled, and being killed when it fails the liveness probe:
In a legacy world, handling this outage would require spinning up another VM (or multiple), deploying an Apache web server on it, validating it’s working, and then adding it to a load balancer. While this can be automated using tools like Ansible, Kubernetes frees us from the manual process by providing the Horizontal Pod Autoscaler (HPA). Let’s set our deployment to scale pods up when the CPU usage hits 80% and set a maximum threshold of five running pods:
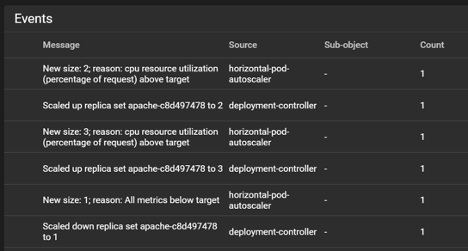
kubectl autoscale deployment apache --cpu-percent=80 --min=1 --max=5We can now rerun our k6 load and watch what happens—we’ll see the pod scaling kicks in via Loggly:
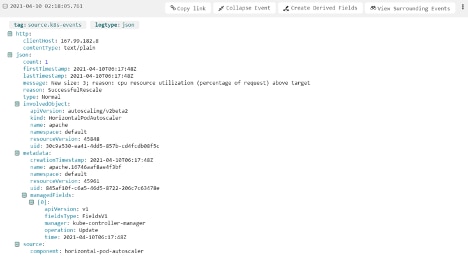
The Kubernetes dashboard itself also shows the points where the steps occurred and when additional pods were spun up:
Once we’ve finished generating our load, we can watch the HPA scale our pods down:
The built-in Horizontal Pod Autoscaler does allow for more customization. You can use multiple metrics to trigger scaling by combining CPU usage with the number of requests hitting the Ingress controller. You can also scale using metrics that aren’t part of Kubernetes itself. Messages piling up in a queue are another case for scaling up the number of pods. However, suppose you want scaling based on events. In this case, the Kubernetes Event-Driven Autoscaler (KEDA) is worth looking into. It can scale based on events happening in systems disconnected from Kubernetes and the metrics collection system.
Conclusion
The power of Kubernetes, when integrated with application performance monitoring (APM) and logging, provides for incredible flexibility and insight into performance. Being able to easily visualize the resource consumption and usage patterns of the platform and systems deployed on top of it adds tremendous value to any DevOps or SRE team. These benefits extend to ICs; being able to quickly and efficiently diagnose issues without requiring additional operational support increases efficiency and productivity. One of the key features is creating alerts, either from metrics thresholds being broken or from monitoring logs from patterns. Proactive monitoring and notifications teams manage and consume ultimately free up SRE teams to ensure the health and scalability of the underlying platform. With all of the SolarWinds platform’s power, ICs’ and SREs’ lives are simpler and more productive.
If you haven’t experienced the simple-to-install and easy-to-use SolarWinds AppOptics, maybe now is the time. Sign up for a 30-day free trial.