What is APM?
Application performance management (APM)—sometimes referred to as application performance monitoring—is used to refer to monitoring tools that allow IT, developers, and business leaders to monitor their backend application architecture to resolve performance issues and bottlenecks in a timely manner.
Put simply, APM is a product that acts like an MRI machine, allowing you to view and fix parts of your application you wouldn’t have been able to (or would be difficult to) without it. However, getting to the bottom of what different alternatives provide is difficult: it’s complex, to begin with, and on top of that, there’s a lot of marketing dollars at work to over-complicate things. This blog will review the core features of APM tools, dive deep into what they mean (and in some cases, how they are implemented), and discuss the costs of an APM tool. Each vendor has their own take on things and their own add-ons, but you want to ensure that you are paying for what you really need, not a lot of bells and whistles that won’t help you better accomplish your primary objective: ensuring the performance of your applications.
Technology analyst firm, Gartner®, breaks APM capabilities into three main segments:
- Digital experience monitoring (DEM)
- Application discovery, tracing and diagnostics (ADTD)
- Application analytics (AA)
Digital Experience Monitoring (DEM)
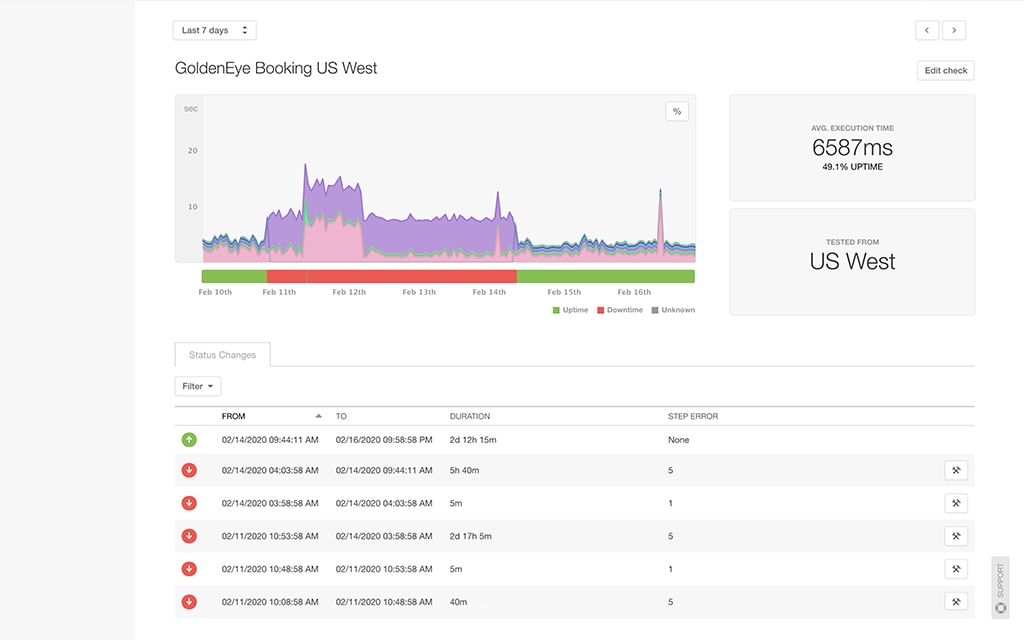
DEM is the monitoring strategy used to quantify and to optimize applications and digital touchpoints to provide a seamless user experience. Gartner verbosely defines DEM as follows:
“Digital experience monitoring is an availability and performance monitoring discipline that supports the optimization of the operational experience and behavior of a digital agent, human or machine, as it interacts with enterprise applications and services. For the purposes of this evaluation, it includes real-user monitoring (RUM) and synthetic transaction monitoring (STM) for both web- and mobile-based end-users.”
Application Discovery, Tracing, and Diagnostics
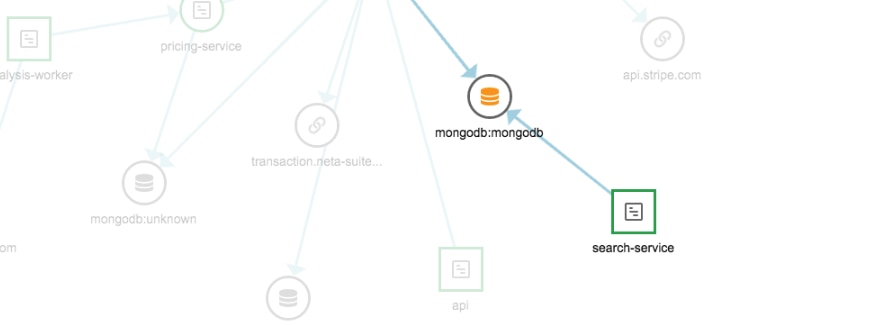
This area is where nearly every APM tool serves their customers the biggest value. Can your APM automatically discover your application topology and map services? Can the tool trace the user requests as they navigate and traverse through your application? And finally, does it provide analysis and the ability to deep dive when there’s an issue?
For the vast majority of APM purchases, this category is the ultimate driver of a purchase decision.
Application Analytics
Application analytics is the ability of the APM product to assist in drill down and provide root-cause analysis. When there’s a performance issue with your application, are you able to understand why and (hopefully) keep the issue from happening again?
What are the key features and use cases of APM customers?
There is a core set of features that all APM products must provide in order to be classified as APM products. In this blog, we review what they are and why they are important. In subsequent blogs, we’ll dive into each one.
This set of key capabilities includes the following:
- Application Time-Series Key Performance Indicator (KPI) Metrics
- Infrastructure KPI Metrics
- Distributed Tracing
- Temporal Event Management
- Intelligent Alerting
- Custom Dashboards
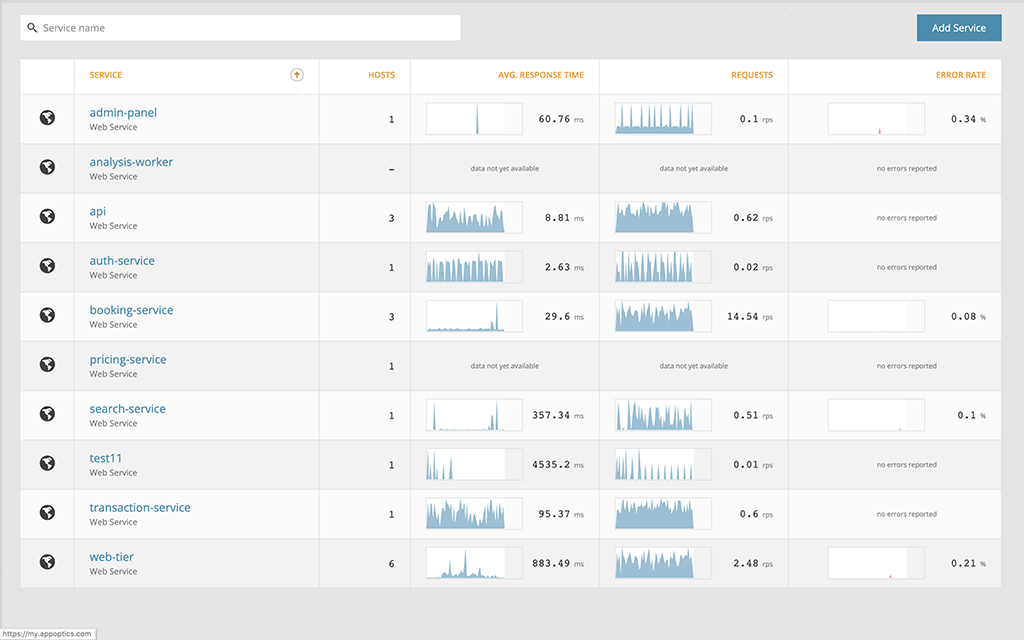
First, time-series metrics track things like requests per minute, average response time, and error rates over time. We say that these are time-series because we want to capture them at different instances of time, plot them over time, and identify changes or trends in their behavior. They can be analyzed and presented at different scopes, including at an application level, service level, transaction level, as well across calls to external dependencies. Time-series metrics are important for APM product because they can be used to identify performance issues as they occur, but more importantly, they can be used to identify trends in performance data before performance issues affect your users. Time-series KPI metrics are at the core of the value that APM products provide.
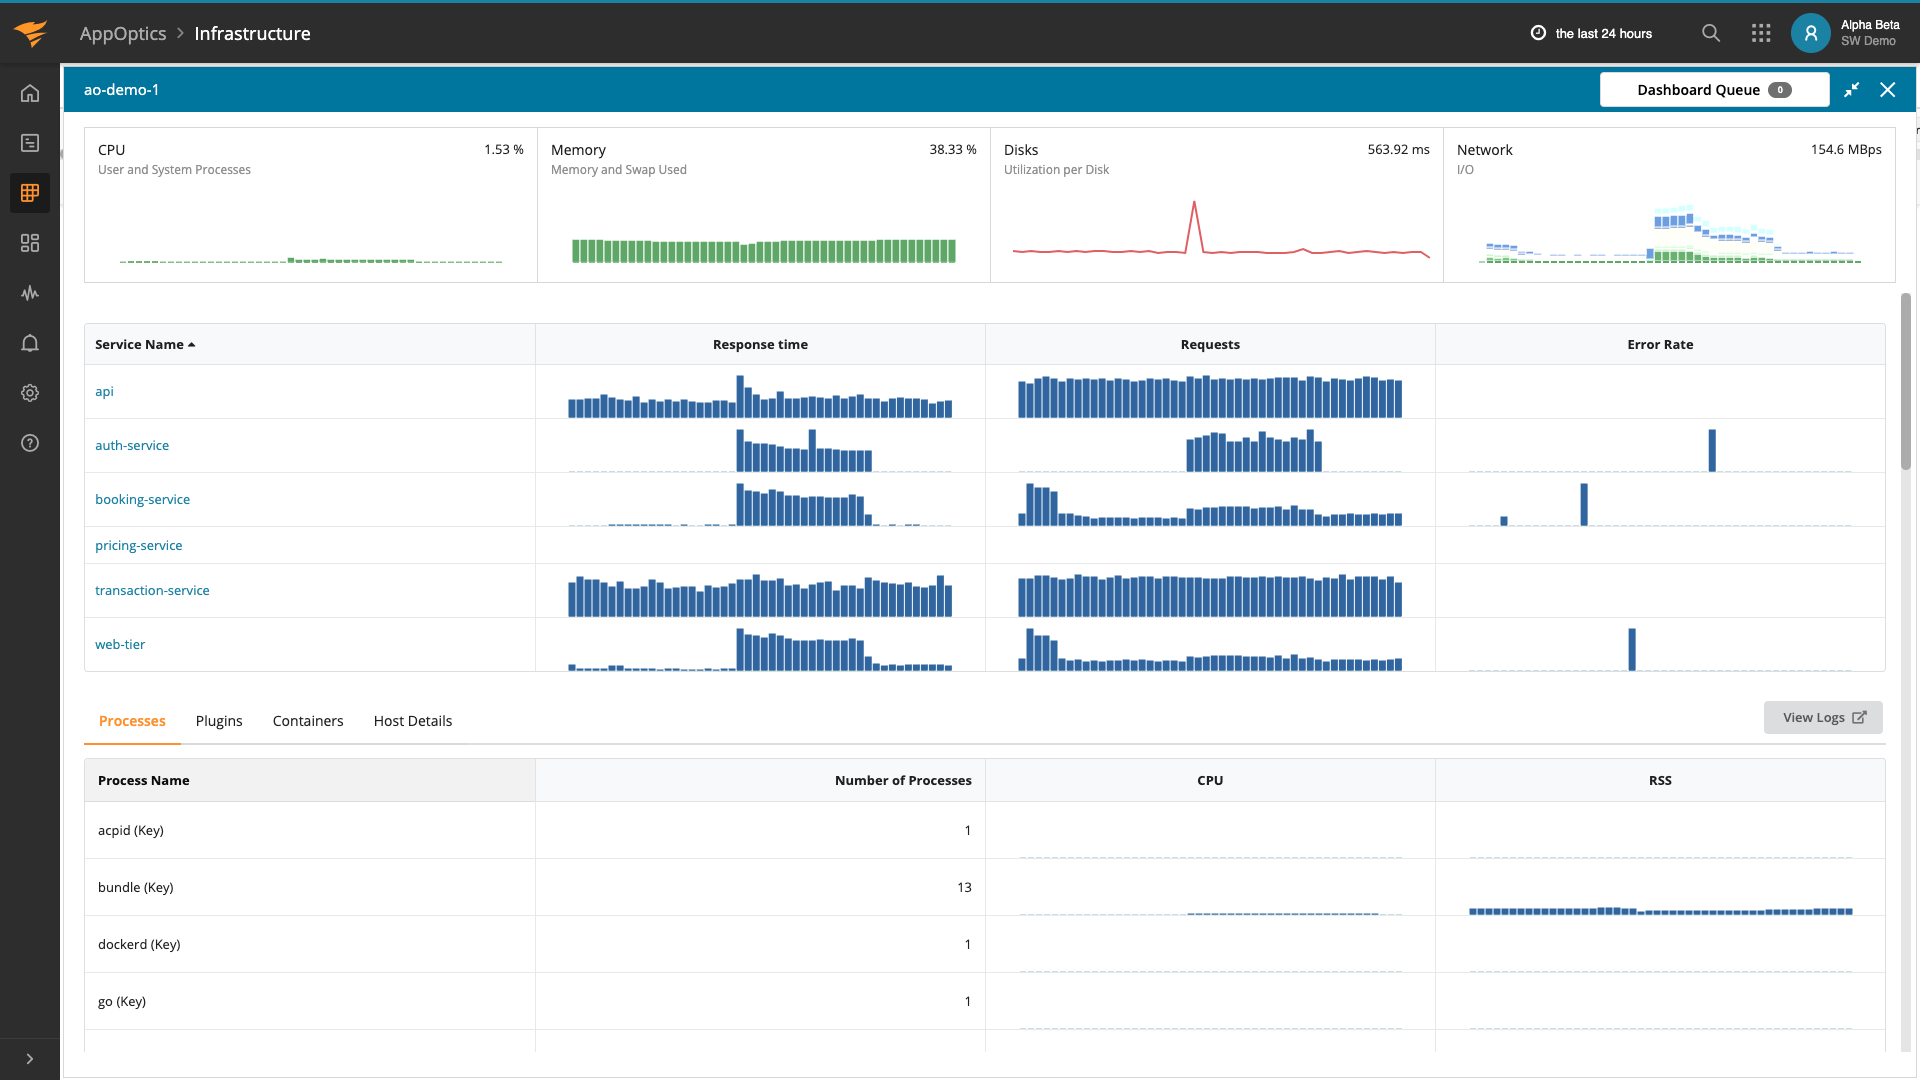
Next, infrastructure KPI metrics measure things like CPU utilization, memory utilization, and disk and network I/O. These metrics are important to capture because they characterize the behavior of the infrastructure on which your applications run. If an application is not yet experiencing performance issues, but its underlying infrastructure is trending problematically, these metrics can provide early warning to help you remediate the problem. Furthermore, infrastructure KPI metrics allow you to better distinguish between application problems and systemic problems.
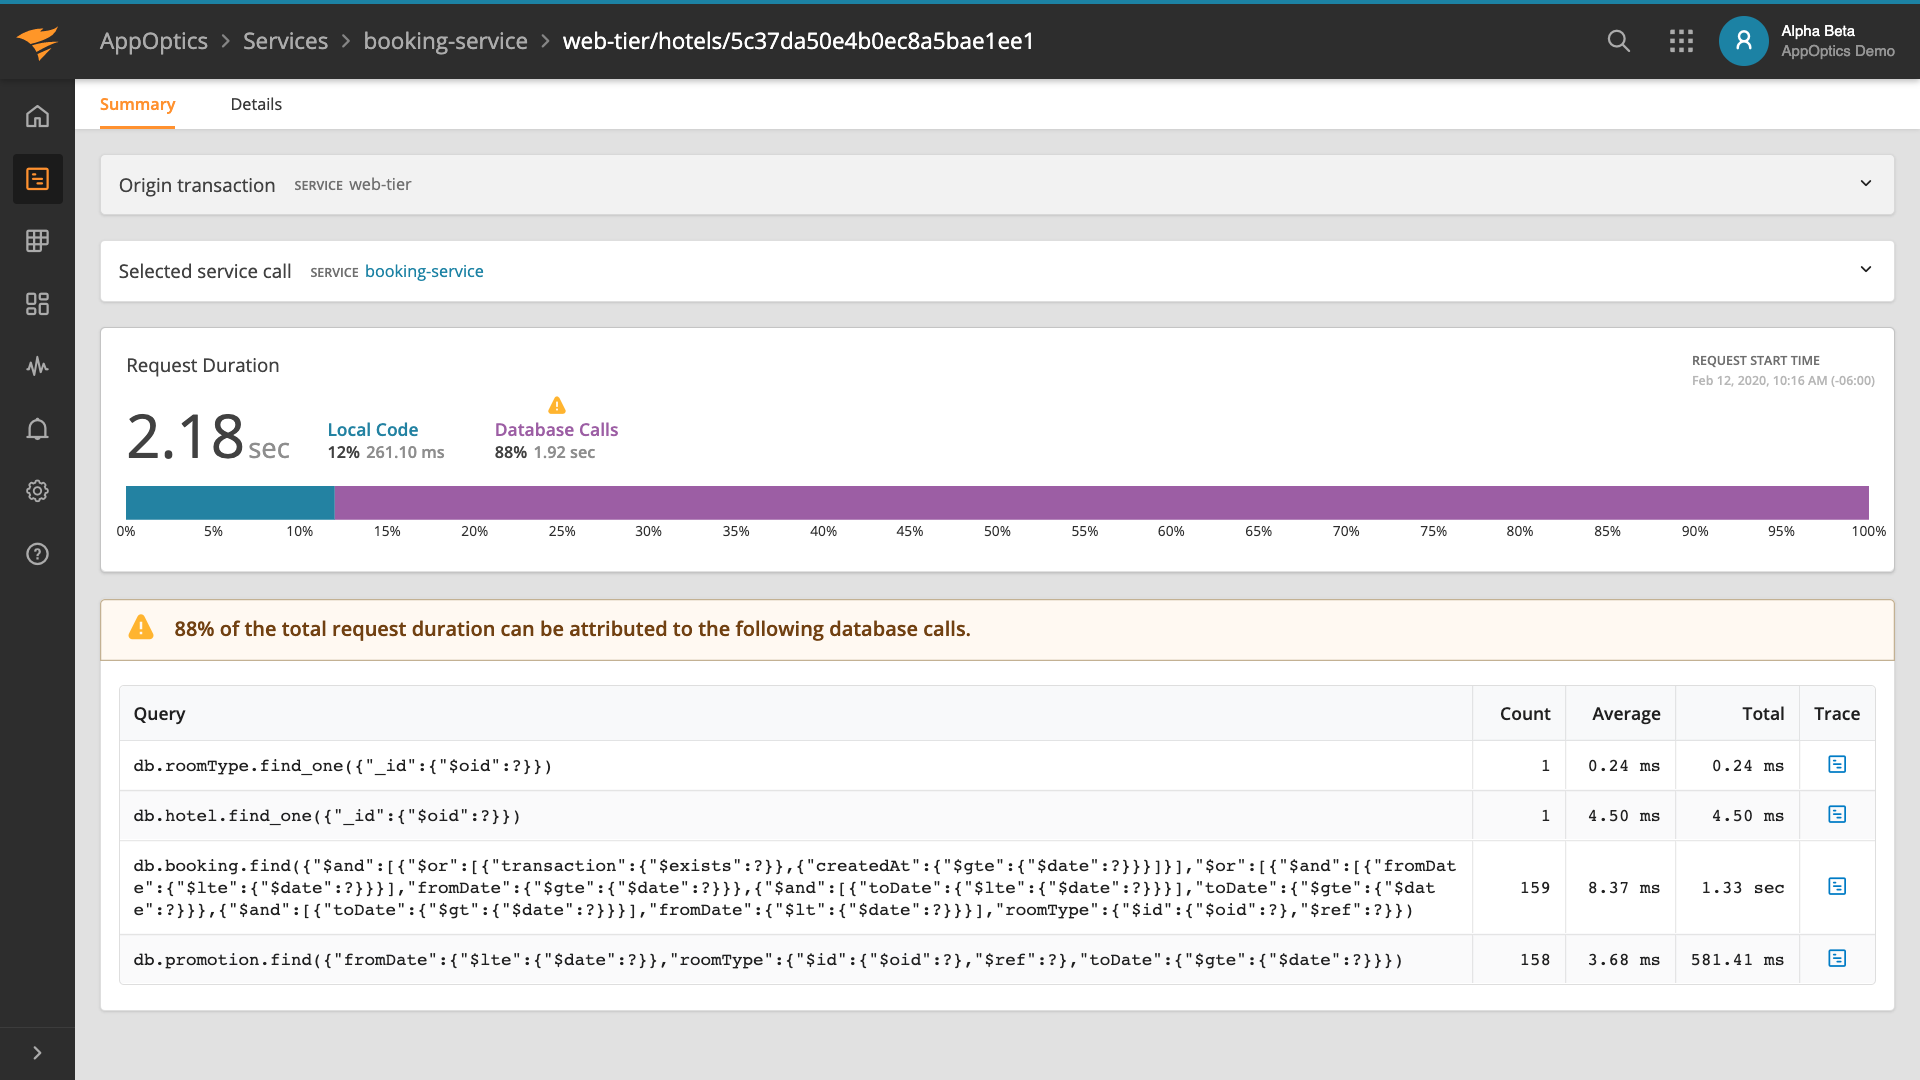
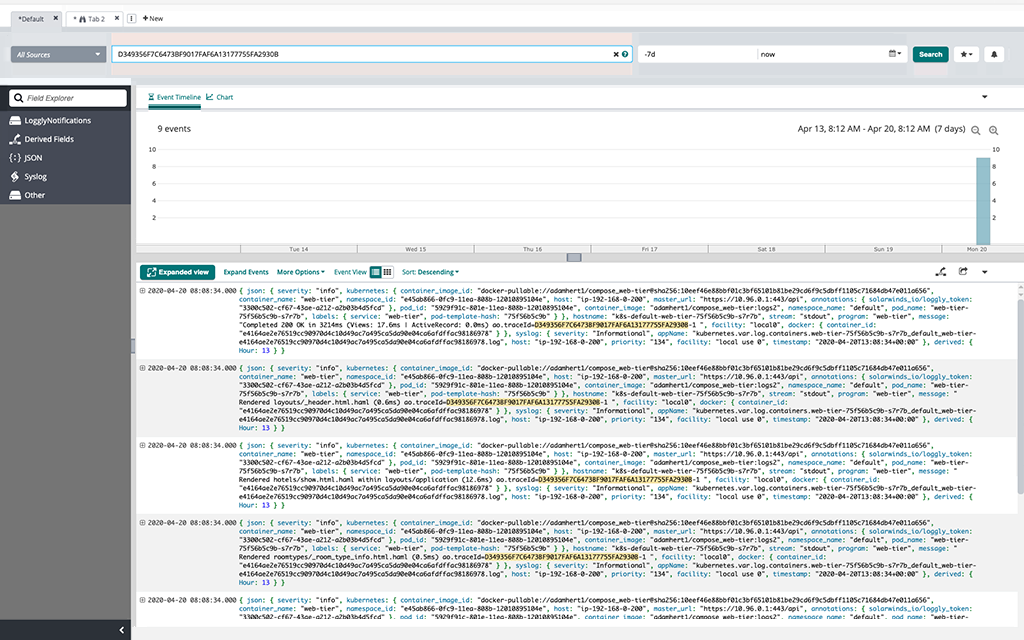
Once you have identified a performance problem with a web or service request, the next thing you need to do is identify the root cause of the issue, which is where distributed tracing comes in. Distributed tracing allows you to view the components that are contributing to your application response time. It stitches together a request across application tiers and external dependencies and then dissects the performance in each tier so that you can see how every component in your application is contributing to your overall response time. All of this is to say that distributed tracing allows you to break down an application response time and see where the majority of that time is being spent. Without this capability, an APM tool would only be a monitor that tells you about a problem, not where the problem is or where to start fixing it. Finally, distributed tracing must be low overhead: the worst thing an APM tool can do is provide rich information but at the cost of slowing down your application.
One constant in IT is that nothing is constant: you can always count on change and need a way to tell your APM tool about temporal events, such as the deployment of a new release or a planned outage. Associating temporal events with performance data allows you to distinguish between application performance or outage issues and the expected behavior during the event. Furthermore, it allows your monitoring to potentially modify its behavior during the event and can help it avoid raising false alerts.
Next, an APM tool needs to have intelligent alerting. Alerting can include things like email notifications, dashboard visualizations, and even integrations with other systems to open a service ticket and assign it to the correct party. But, in order for alerts to be intelligent, the APM tool needs to be configurable to understand the nature of your application and its behavior so that it can detect anomalies. In the early days of APM, it was quite common to define static thresholds, such as raise an alert if this service call takes more than three seconds to return. As APM solutions evolved, alerting became smart enough to perform rudimentary statistical analysis and allowed for alerts based on things like standard deviations or percentage differences from the mean. Today, APM tools are smart enough to understand the behavior of your application and establish a baseline, allow you to define the strategy to use when analyzing requests against your baseline, and intelligently alert when there is a real problem that you need to review.
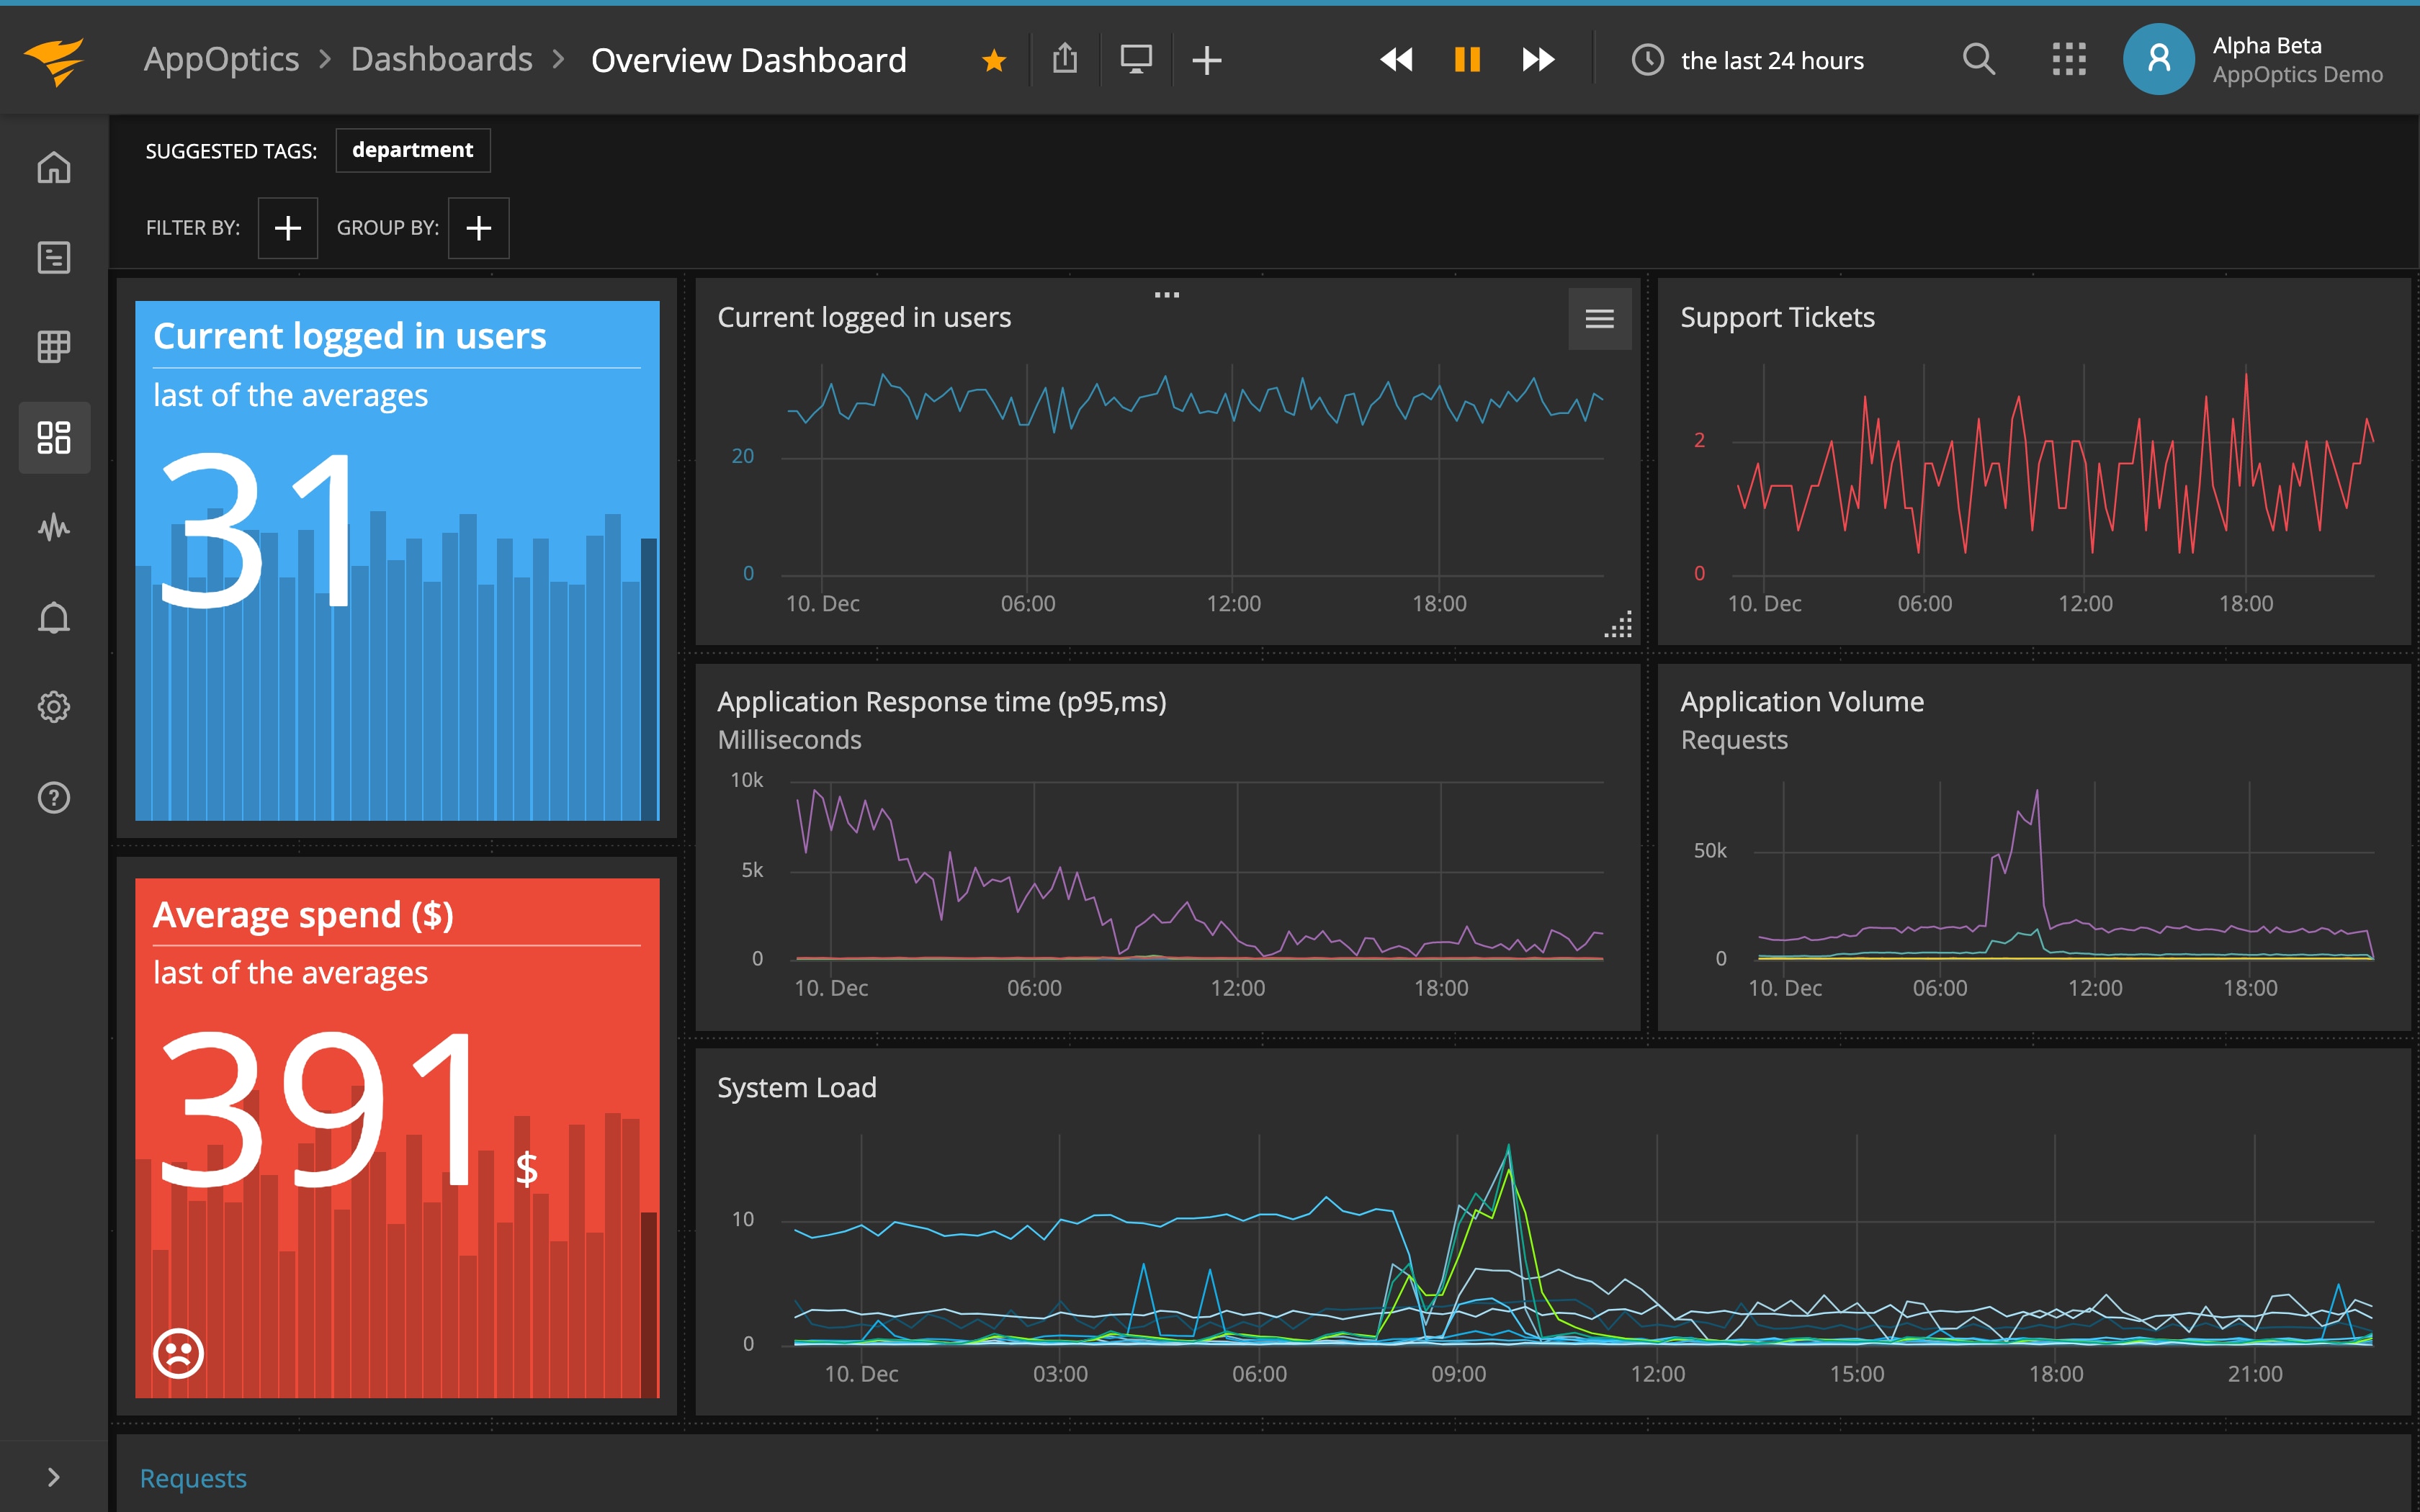
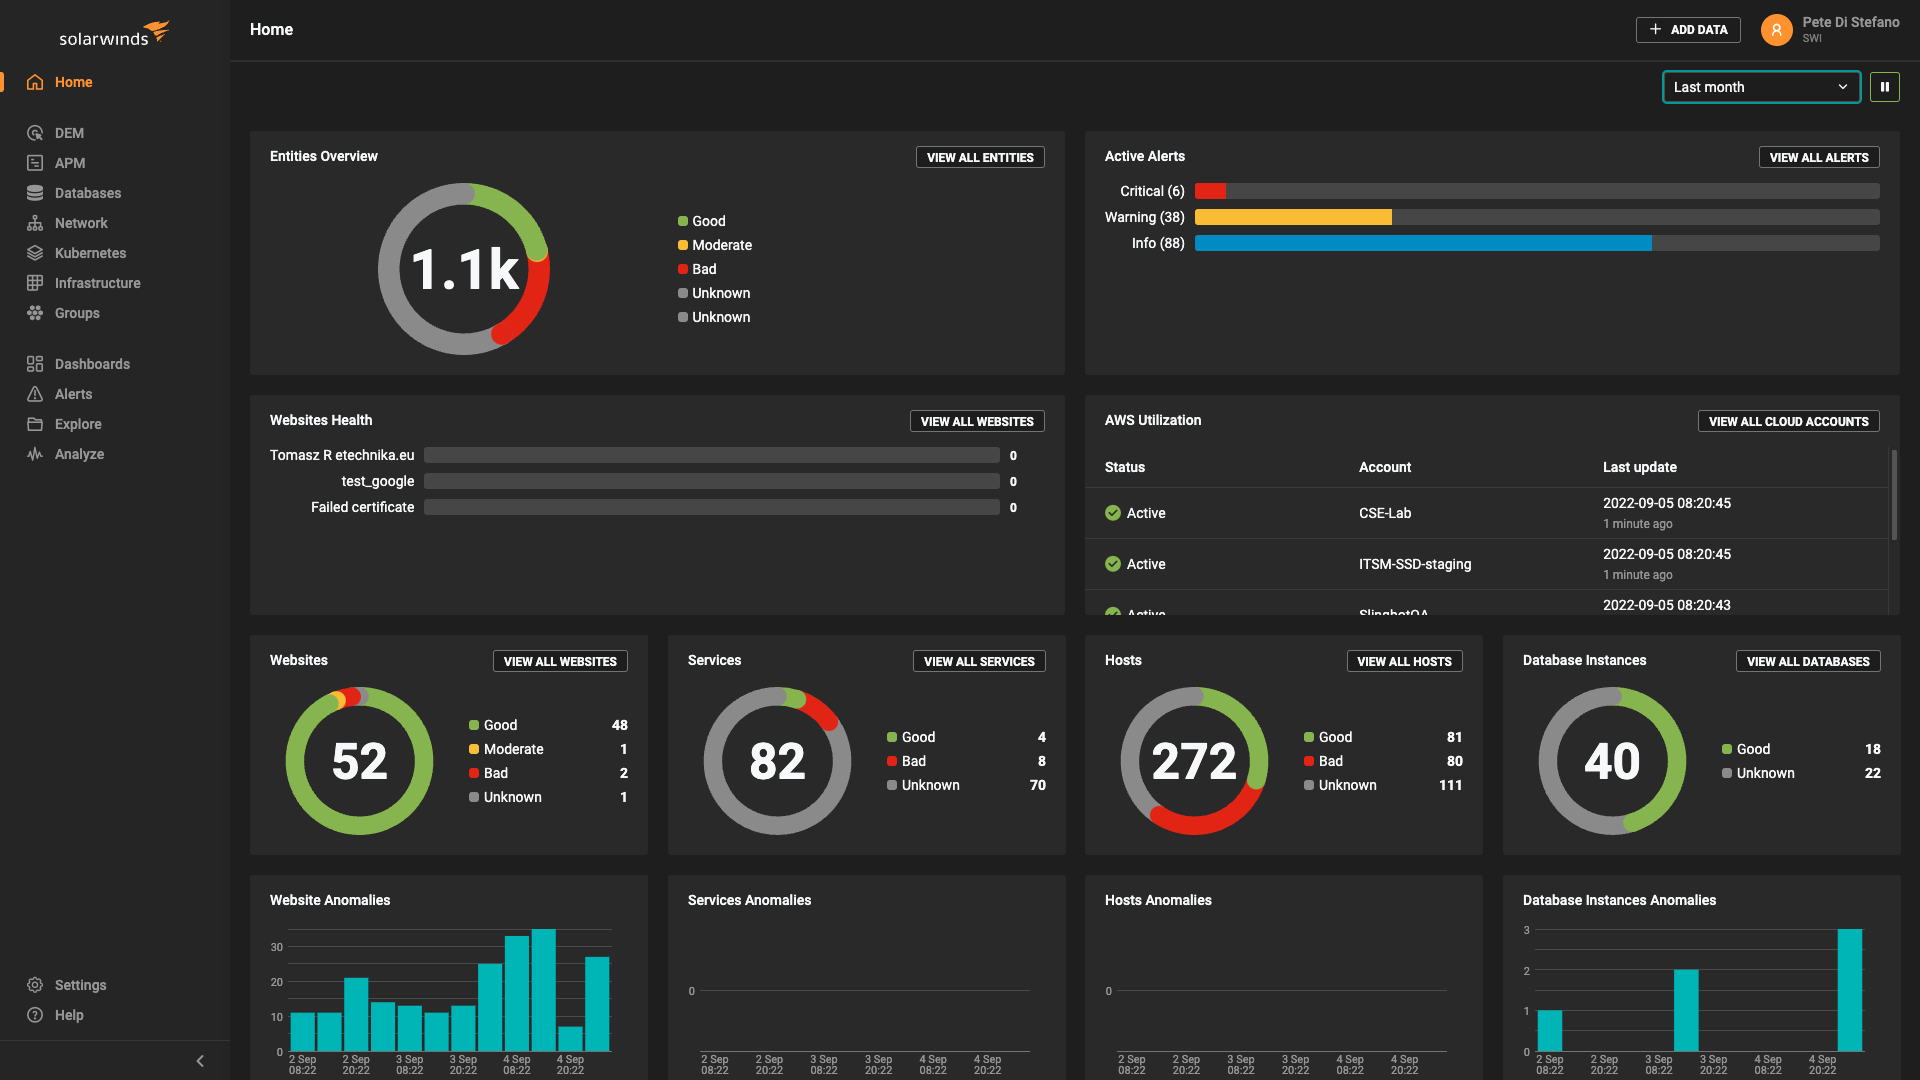
Finally, APM tools need to allow you to create custom dashboards. Many APM tools come with a collection of beautiful visualizations, but the important thing for you is a visualization of your specific business processes. You need the flexibility to be able to create dashboards that show the things that are important to your business. For example, you may have a web service that handles your payment transactions so it might be important to your business to show things like the rates that transactions are completing, the average amounts of those transactions, as well as the response time and error rates. APM tools have no intrinsic way to understand that a service is vitally important to your business so it is important that your APM tool affords you the flexibility to expose important business processes via custom dashboards.
